Workspace and Viewing Preferences
Dashboard
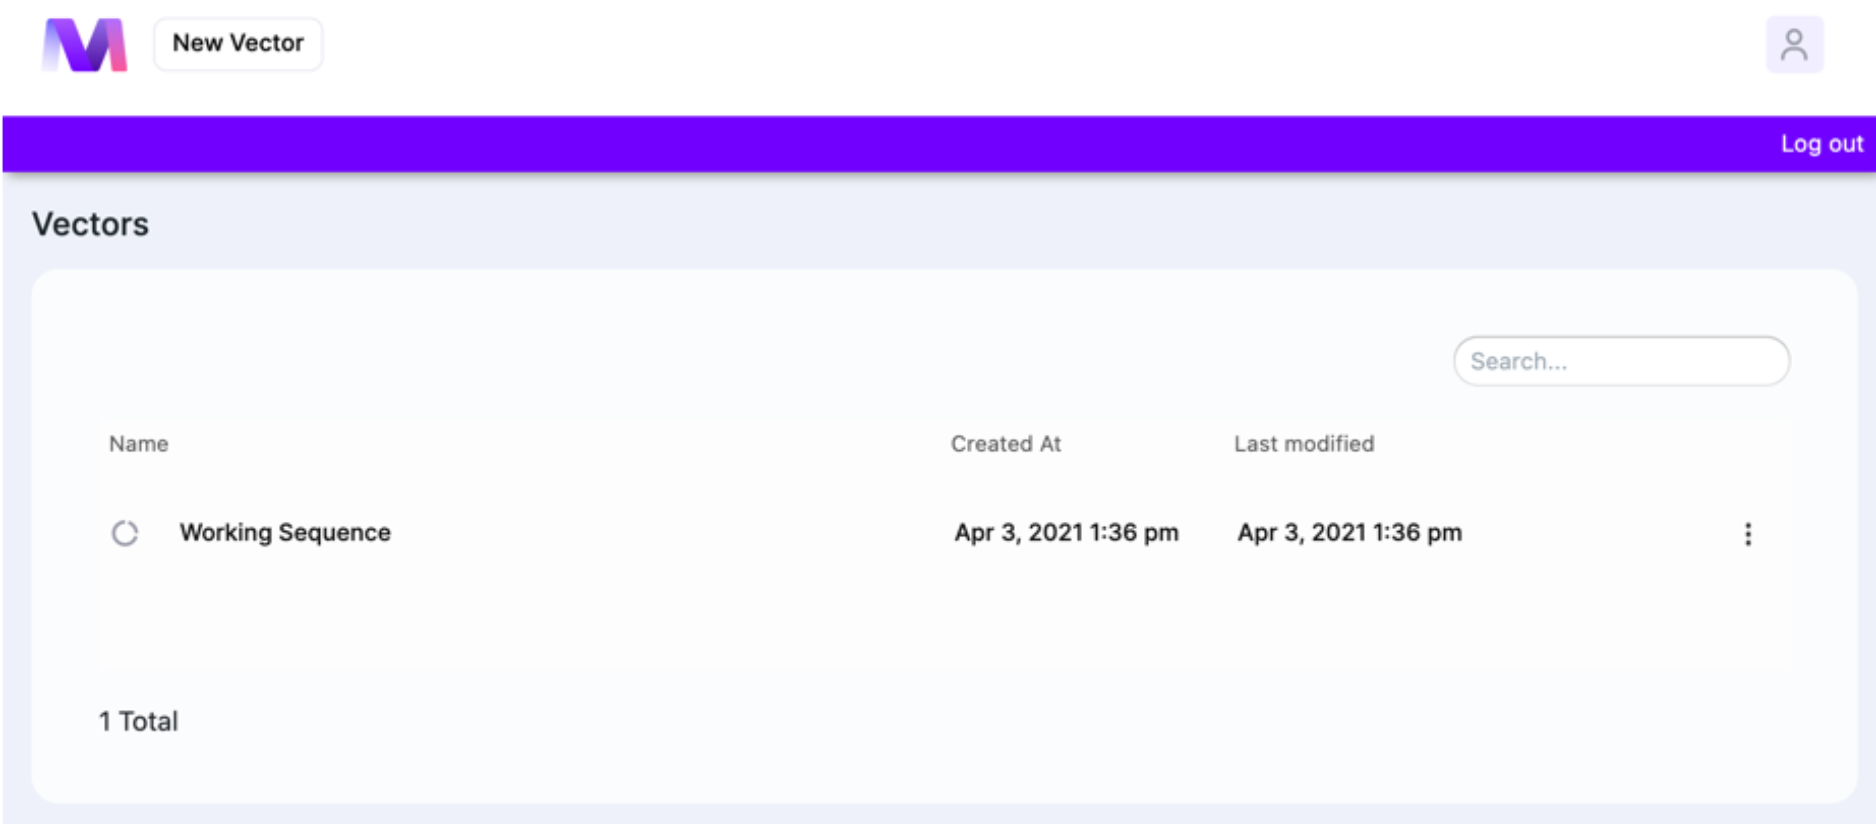
The Dashboard is the first thing you see when you log in. It is where you start creating sequence from (click on “New Vector”). The Dashboard’s organization Is very simple: you see the list of vectors (sequences). For each file, the creation date and last modification date are displayed, and to delete sequence, click on ⋮. Clicking on the User icon gives an option to log out. The total number of sequences is displayed in the bottom.
The Contents and Panels of the Workspace
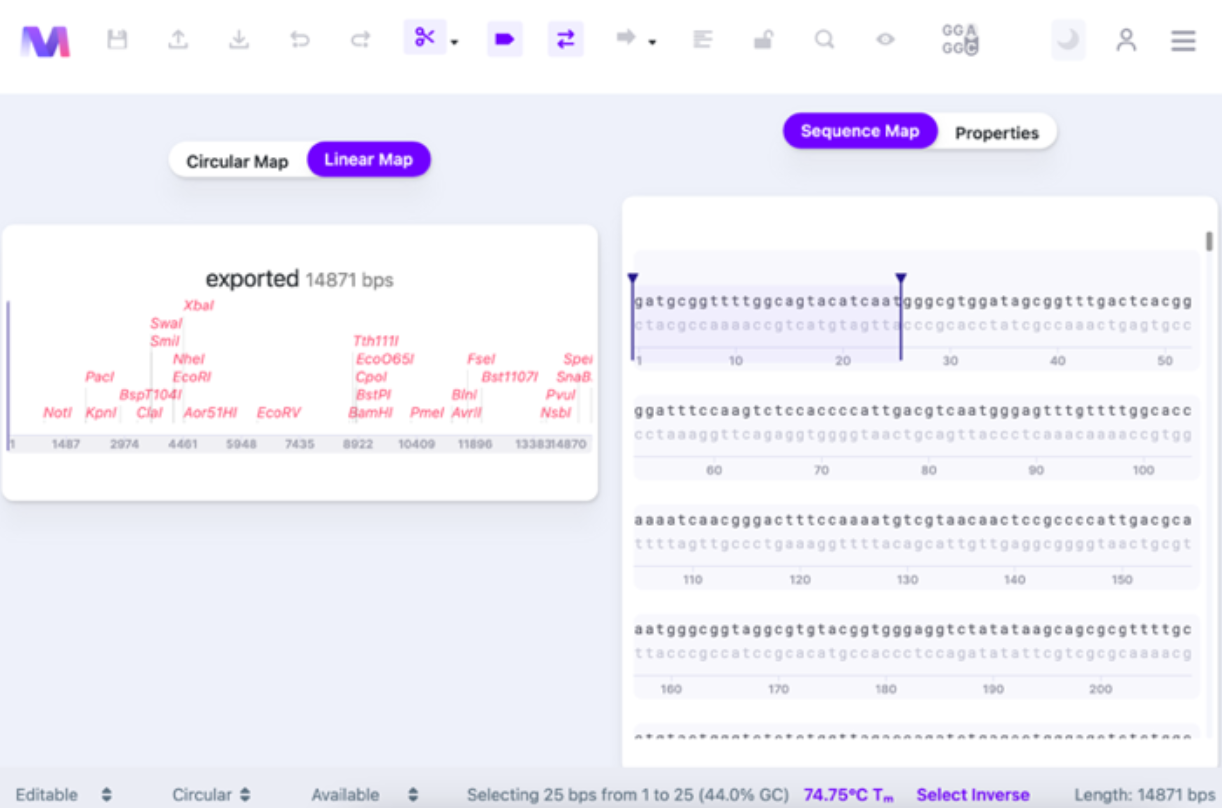
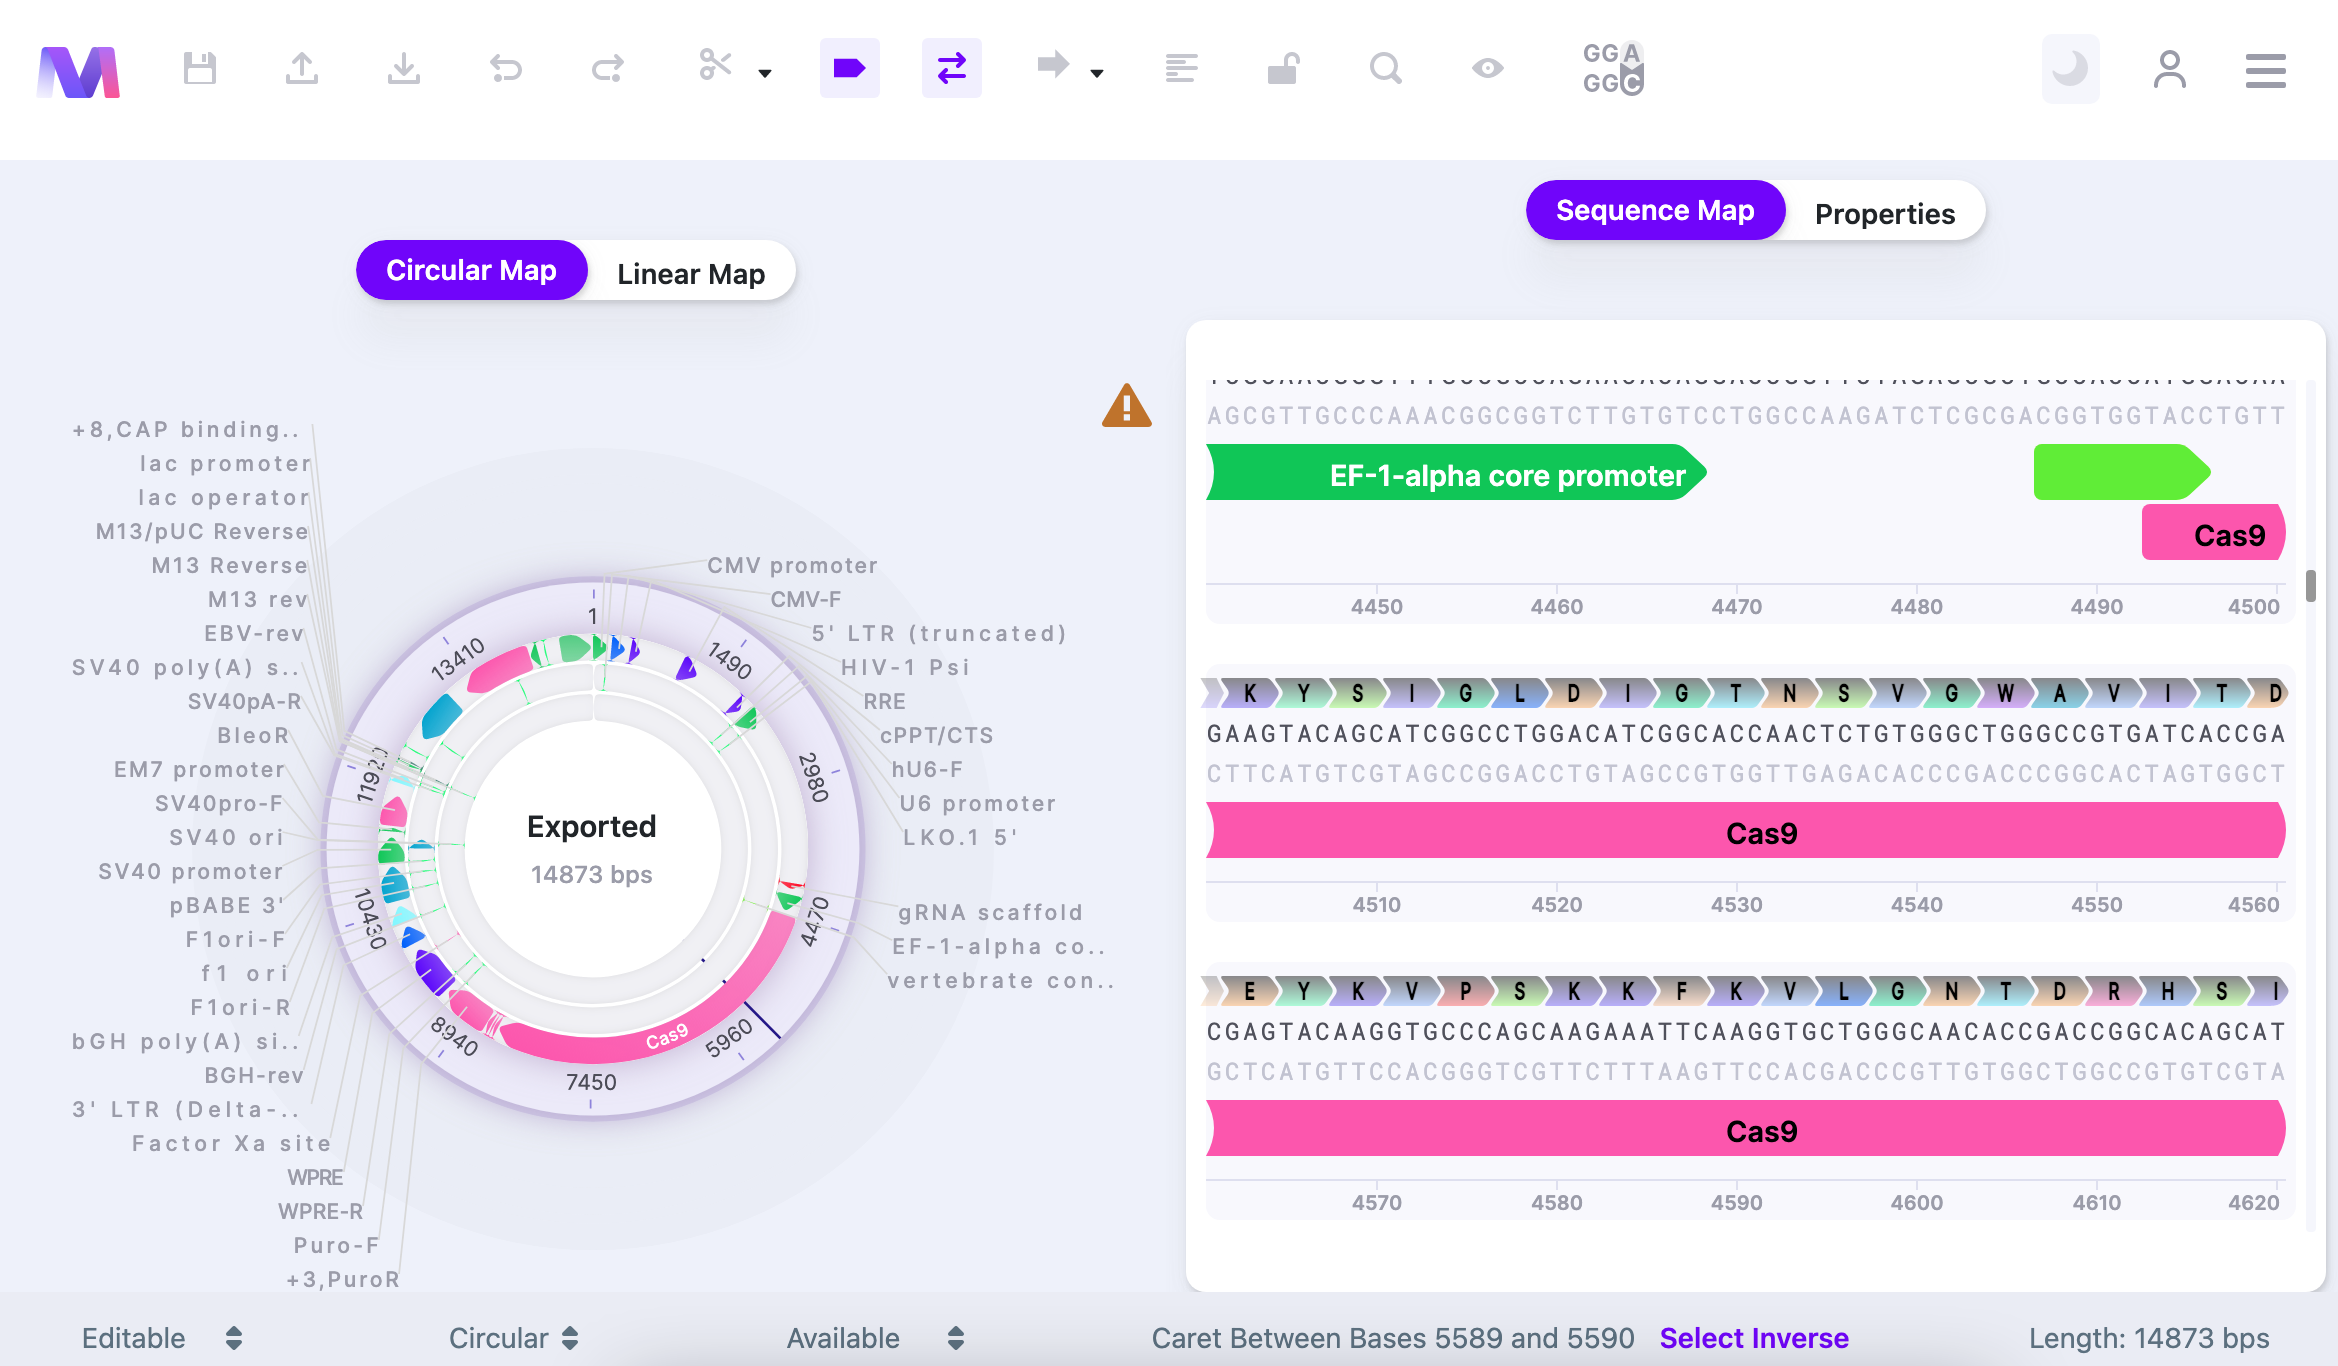
Your workspace contains the main Control Panel on the top, an additional Feature Panel on the bottom, two view modes for your sequence on the left, and sequence itself/properties on the right. To learn more about extensive features within the Control Panel, read here.
The bottom panel allows you to make the following changes to how you see the sequence (no bases selected):
- Editable/Read-only
- Circular/Linear
- Available/Unavailable
- Position of Caret (will be displayed as “Caret Between Bases … and …”)
- Select Inverse (selects all bases of the vector)
- Length of the vector (in bps)

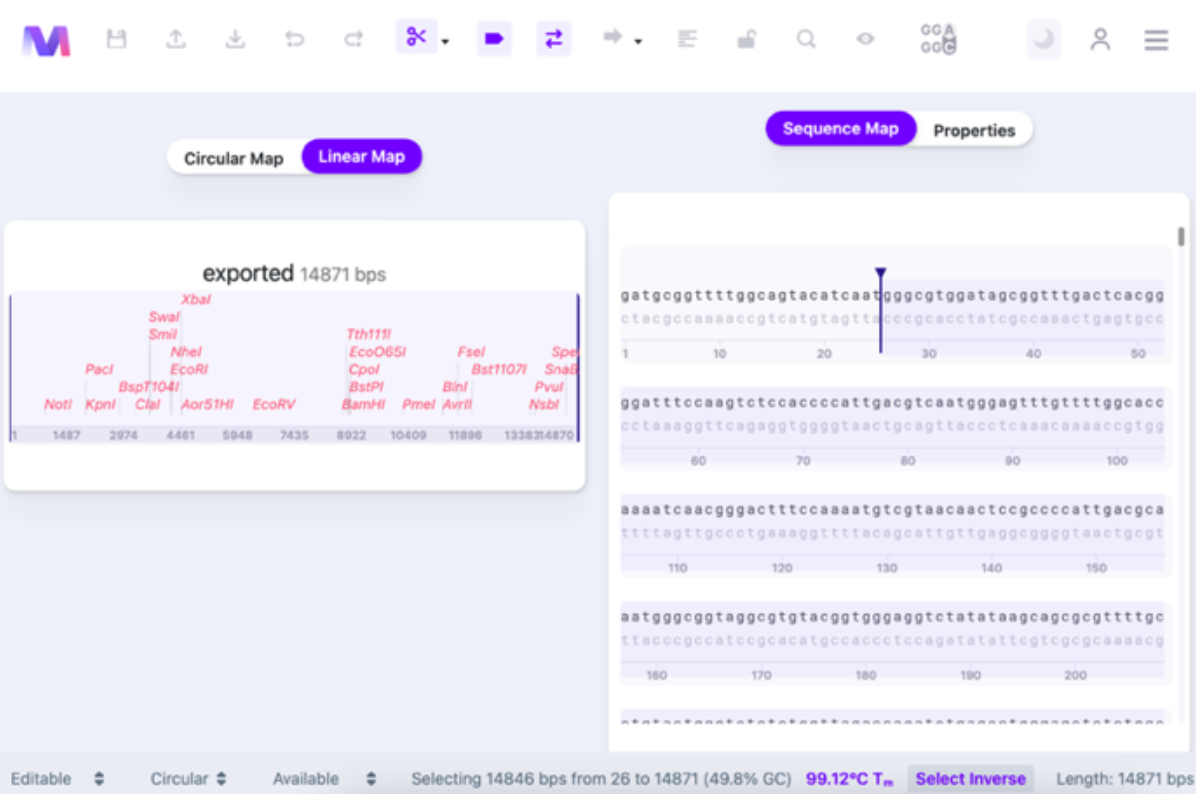
Once you select the bases, there are some changes: you will see the number of base pairs selected, positions of the first and last base pair selected, GC content (in %), and Tm.

Once you click “Select Inverse”, the rest of the vector will be selected, except for the region you picked.
You can select what algorithm has been used for calculating the Tm of the sequence. Click on the bottom panel’s Tm value (See Thermodynamic Settings for details).
Sequence and Vector View
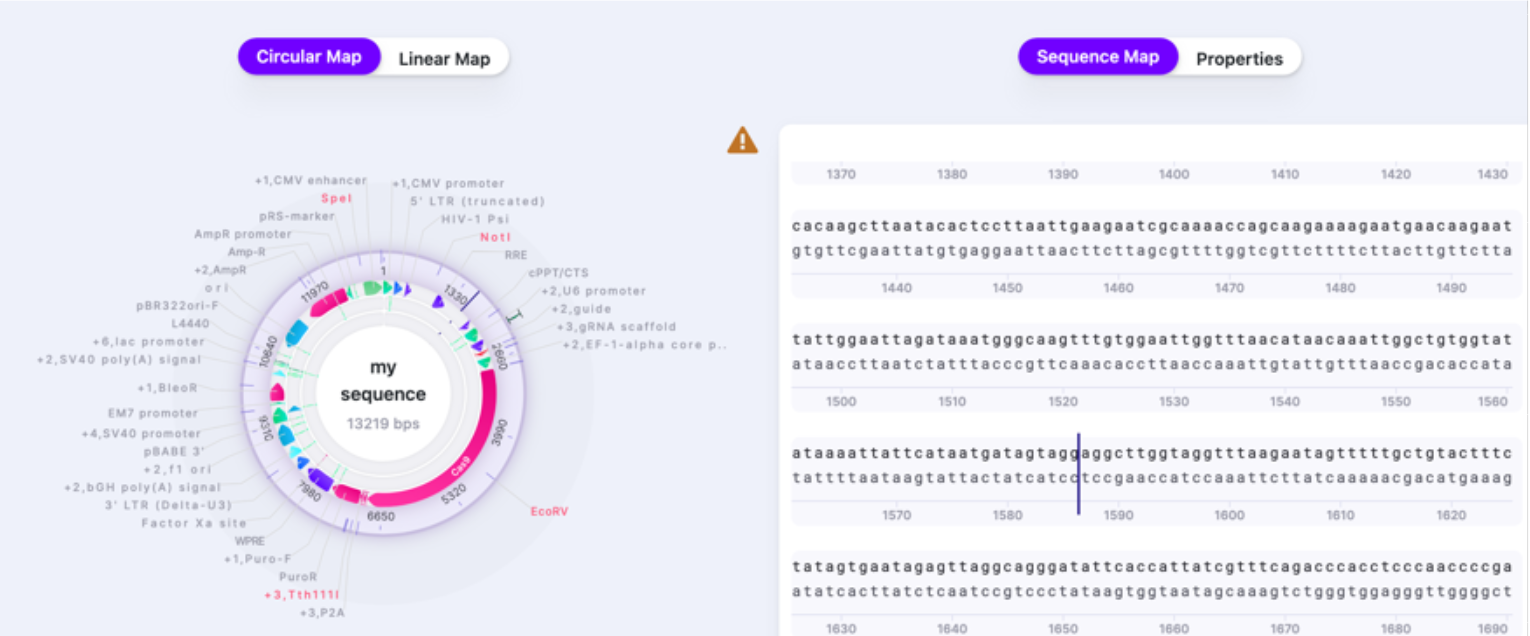
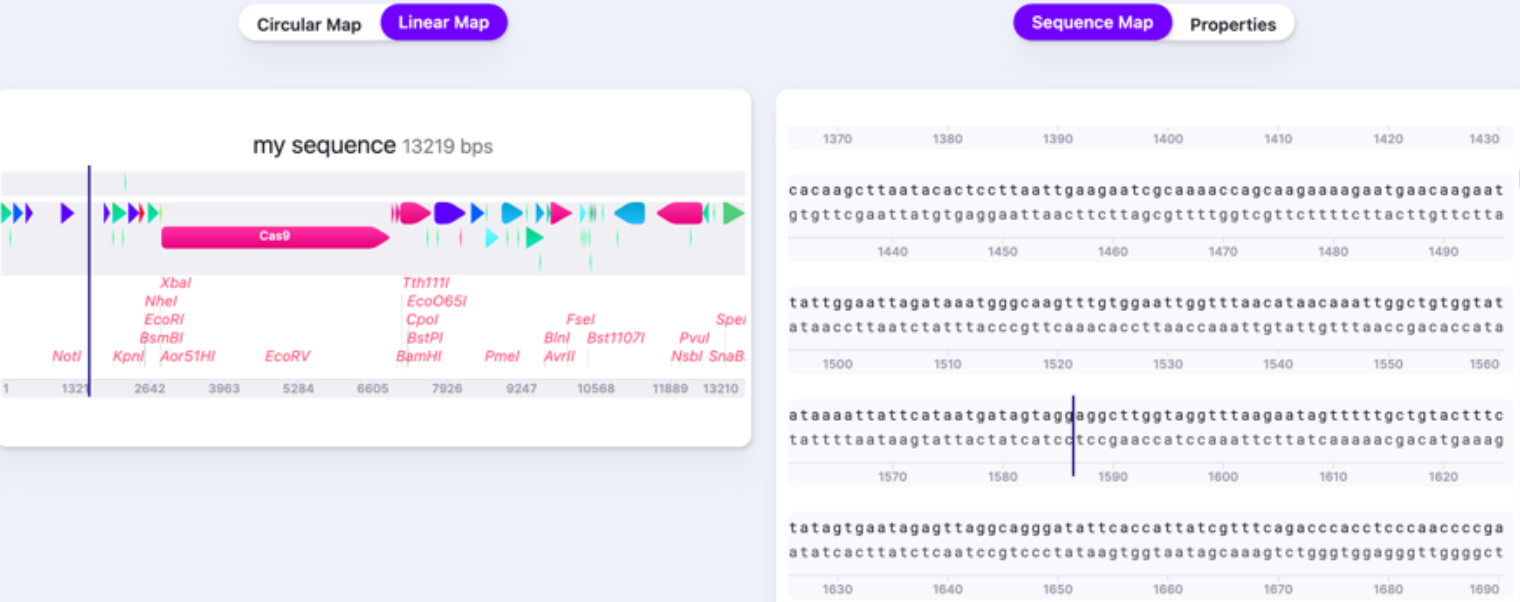
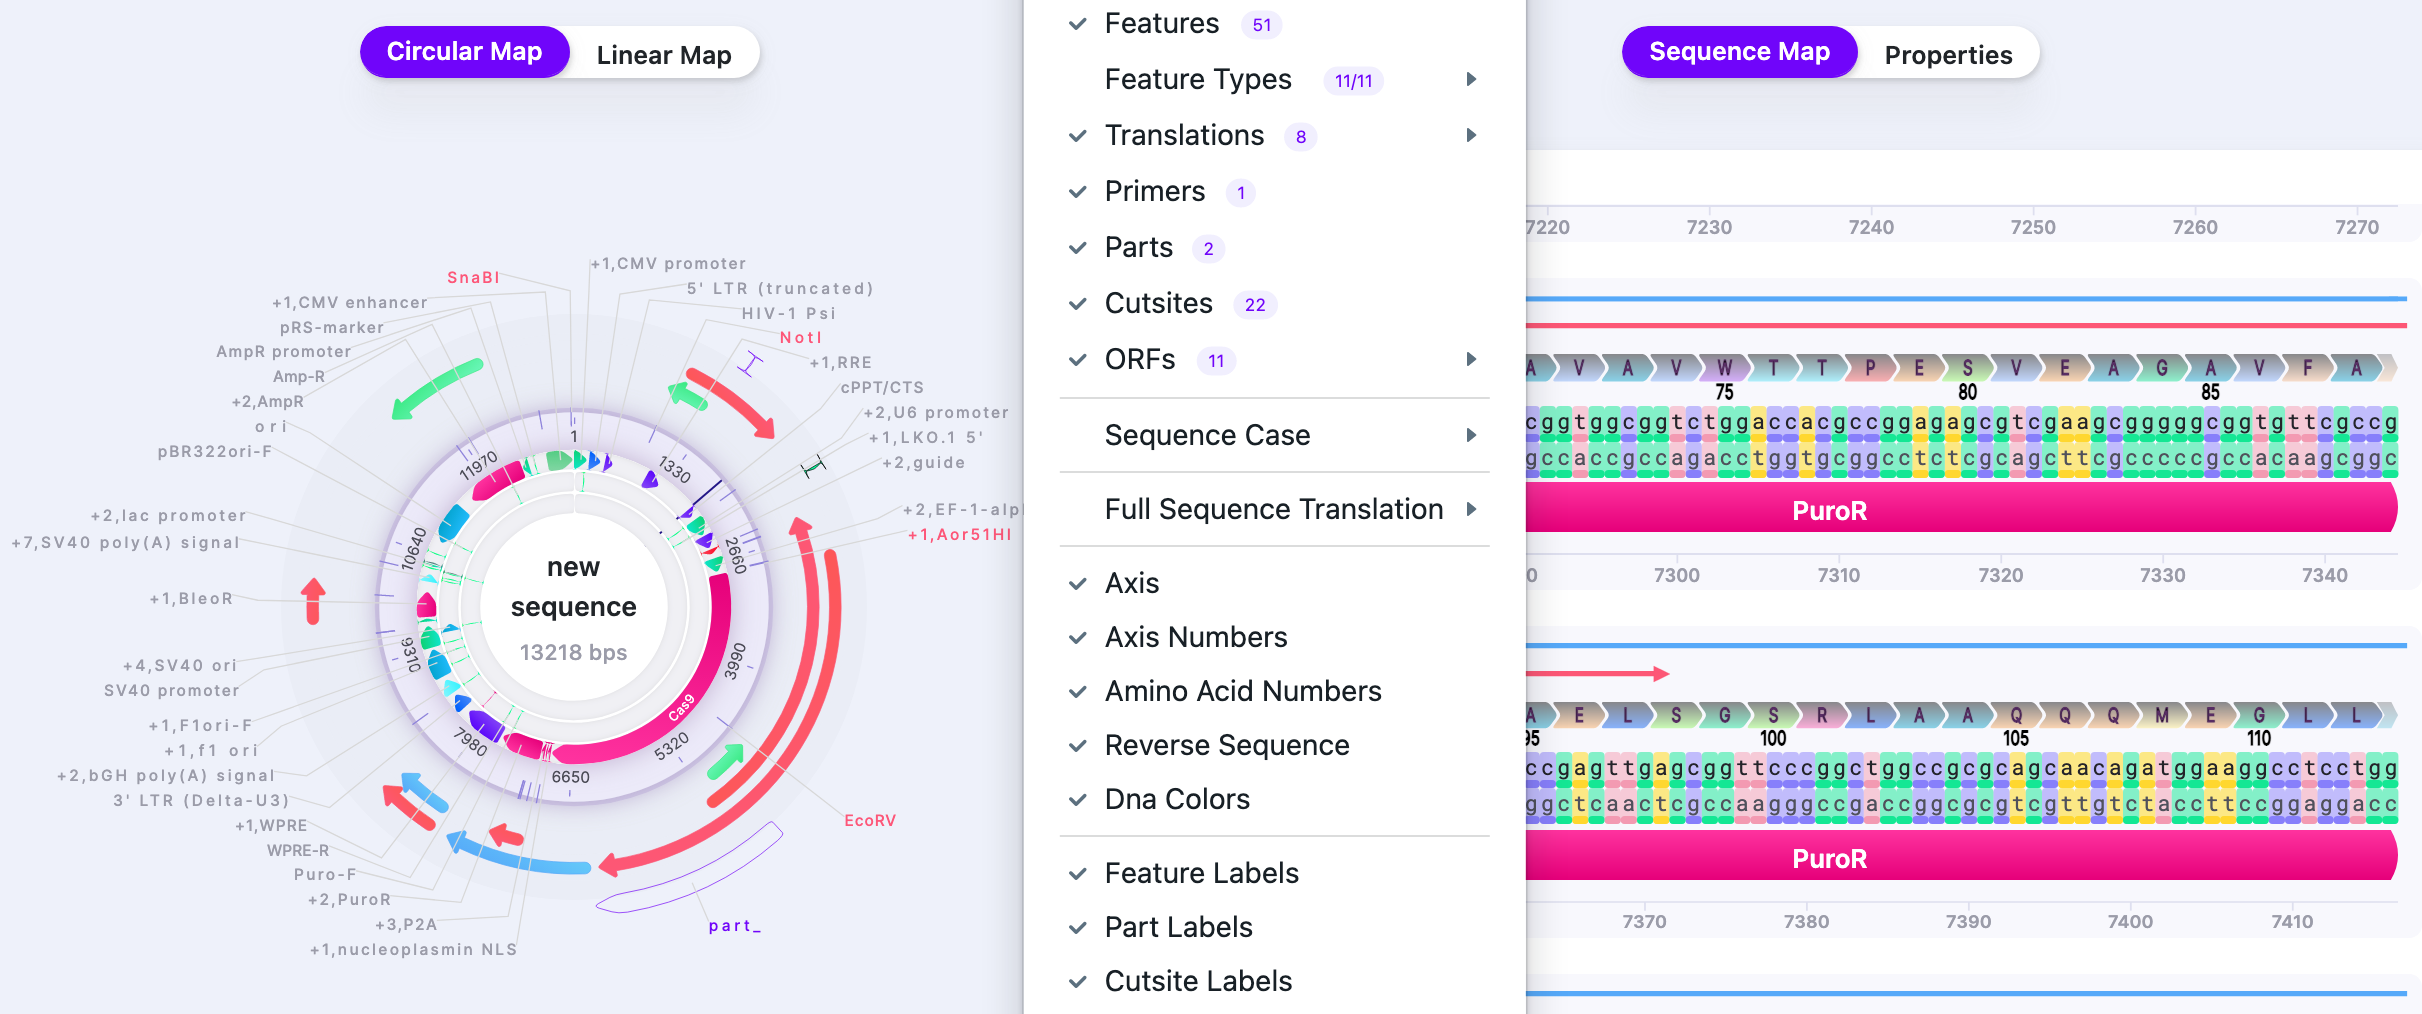
You can select how you view your vector: either as a Circular Map or Linear Map. This view is display only (it is not possible to make nucleotide changes directly on it – only on Sequence Map) and it helps navigate within your vector and see it more broadly. To navigate to the location/feature on the Circular or Linear Map, click on it, and the caret will jump to the location on the Sequence Map. Sequence Map contains an editable sequence, where you will perform your editing. As you reach the end of your sequence, there is a button that returns you to the beginning (first base) of the sequence.
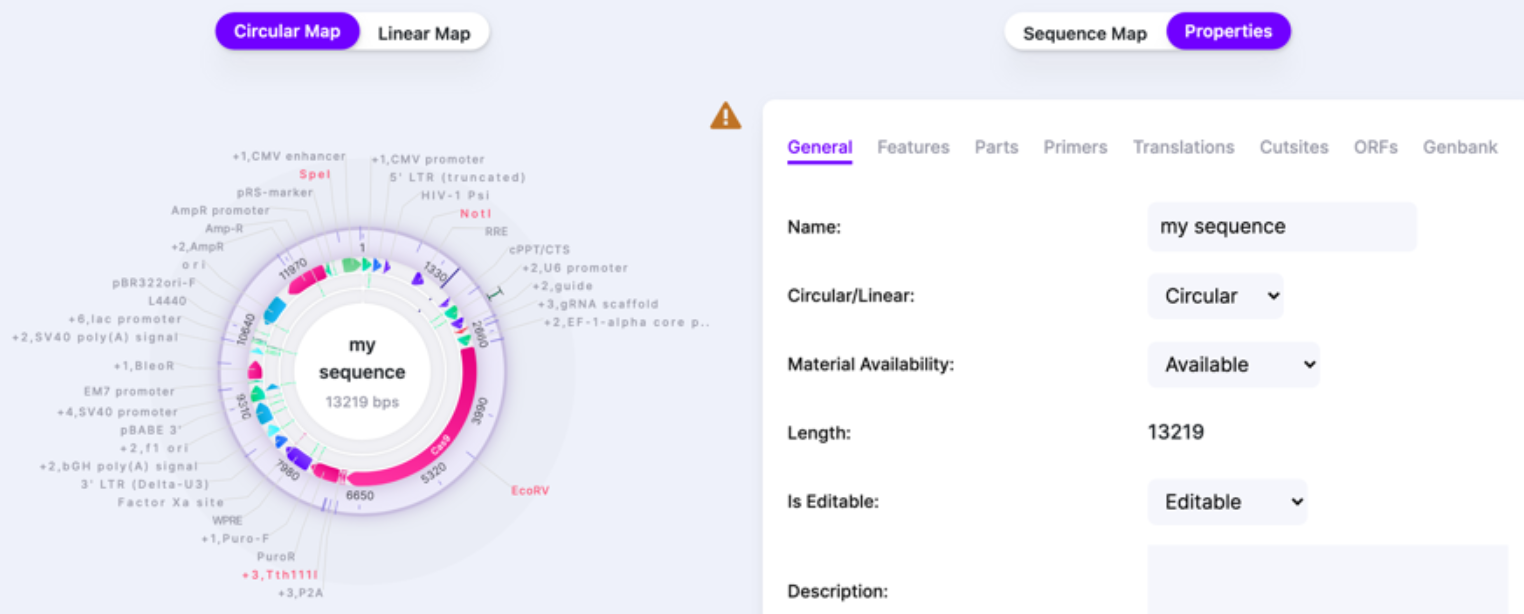
The Properties window shows the summary of your sequence metrics: all features, parts, primers, translations, cut sites, ORFs. Additionally, it provides GenBank entry for your sequence. You can edit the Name of the sequence and write up a short description in the Properties window as well.
Zooming in Function
Zooming Map is also available. To access it, select “Open Zoomable View” in “View”:
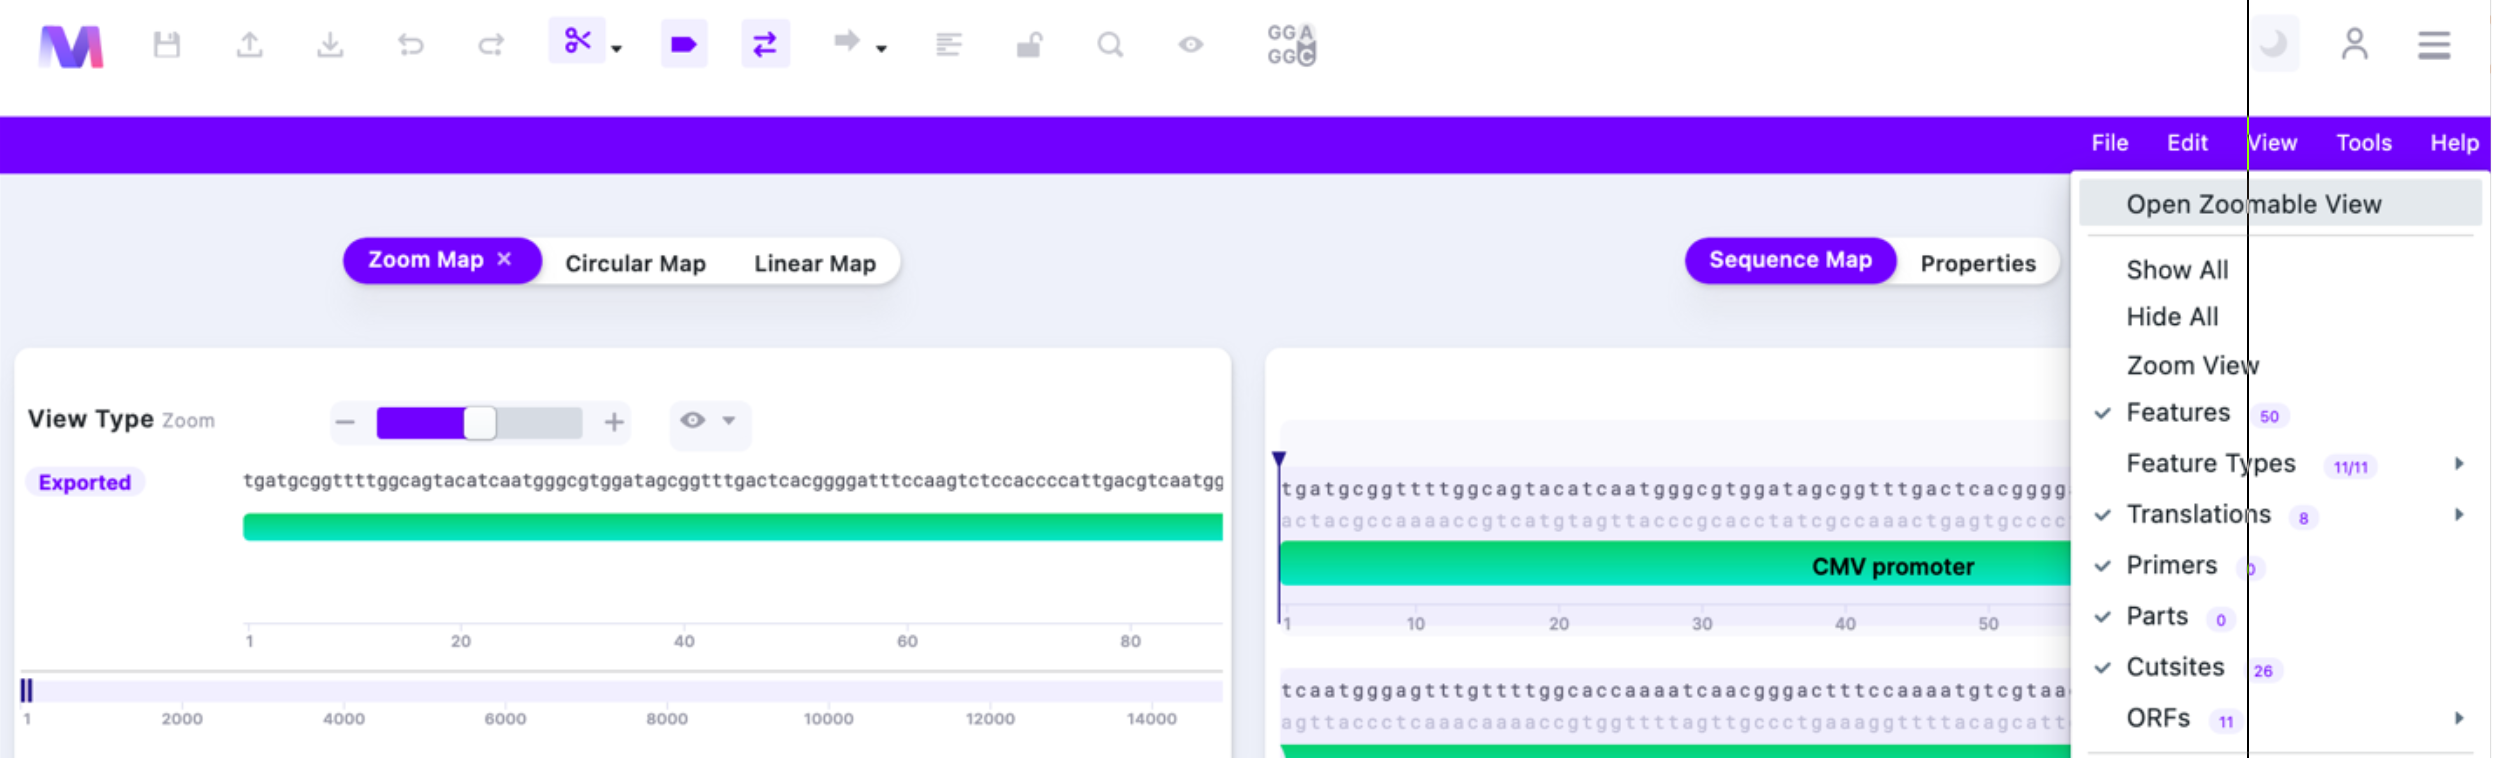
The Zooming Map allows you to navigate the plasmid map and zoom into the features/parts.
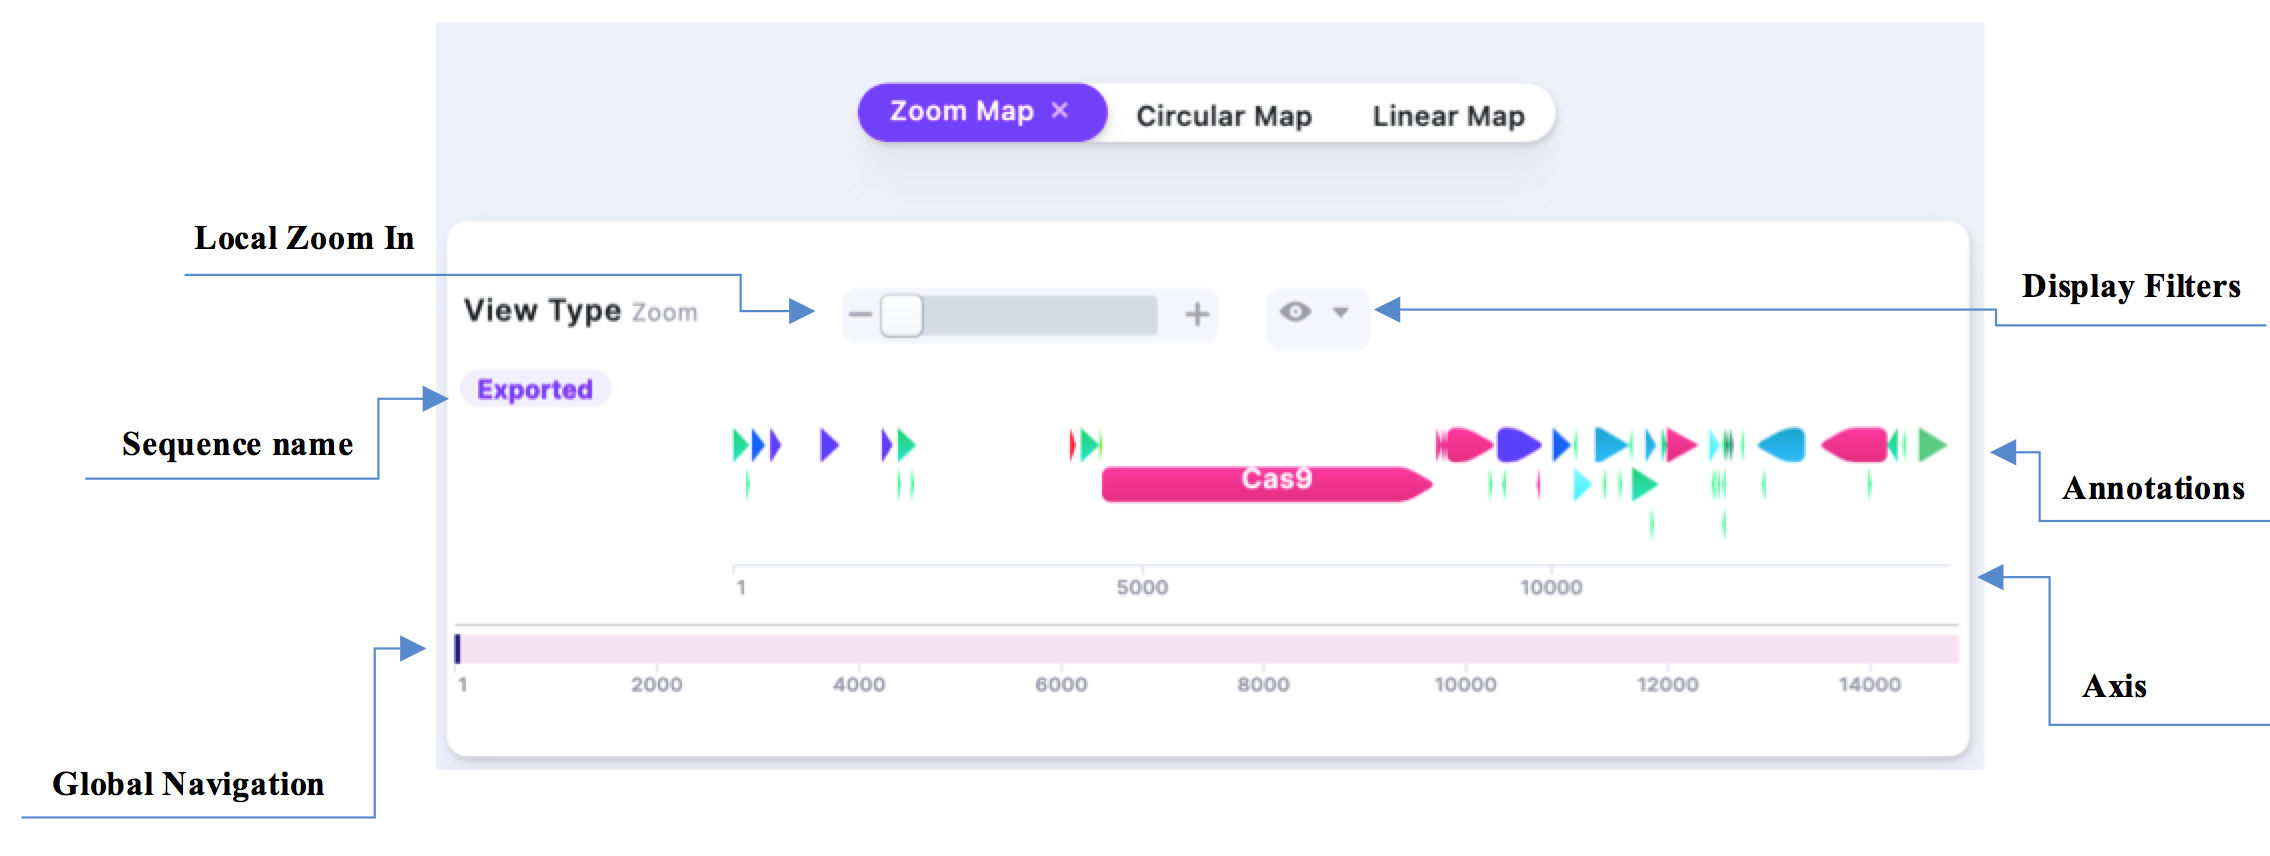
See below for detailed explanation of the basic functions.
| Local Zoom In | Zoom In to see the nucleotide level. Zoom Out to see the feature/part level. | 1. 0%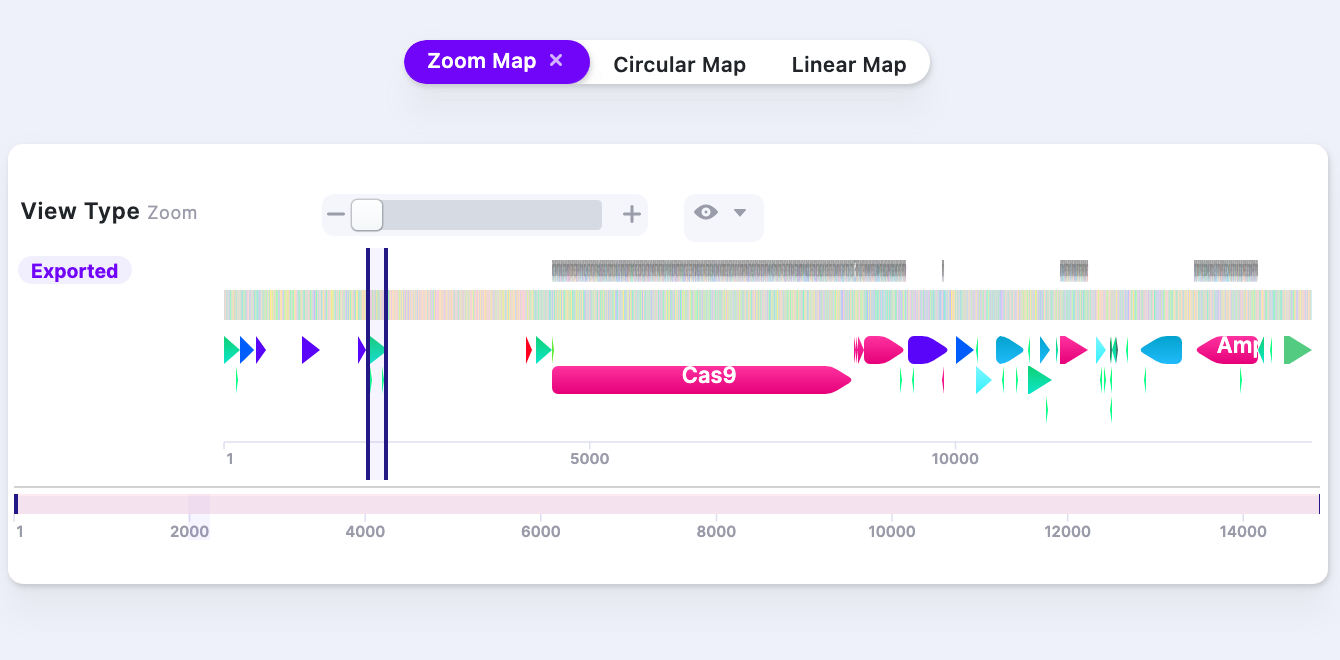 |
2. ~50%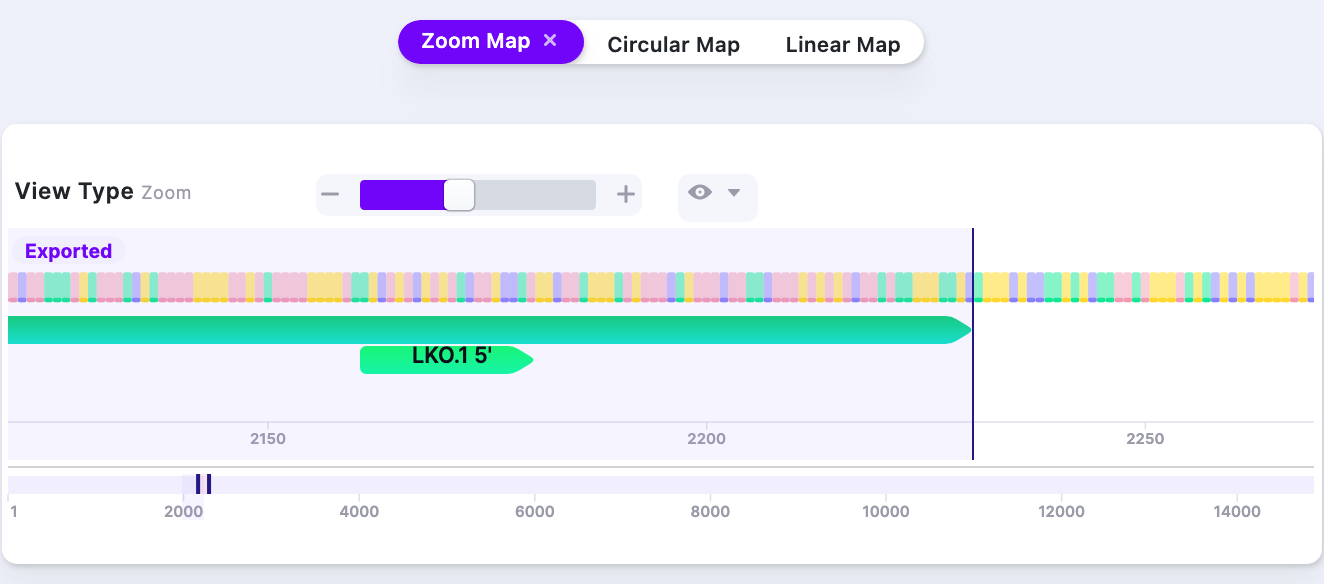 | ||
3. ~80%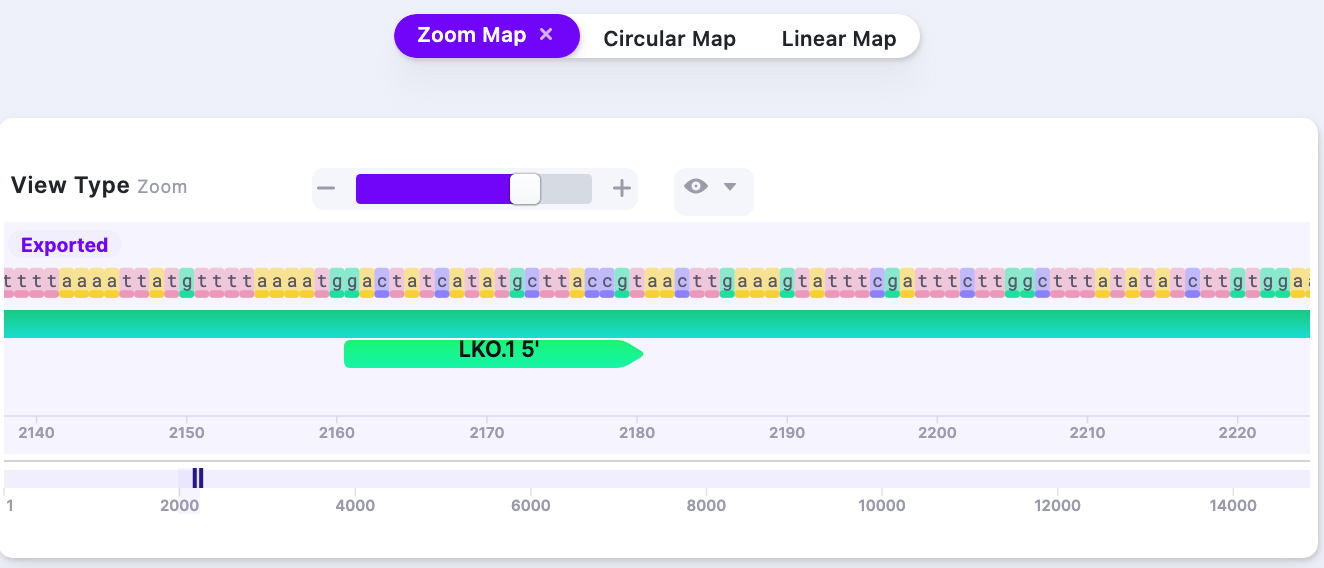 | ||
| Global Navigation | The axis corresponds to each nucleotide position in the sequence. Slide left/right to move along the vector. The slider can be extended (Picture 2) to capture larger part of the sequence. | 1.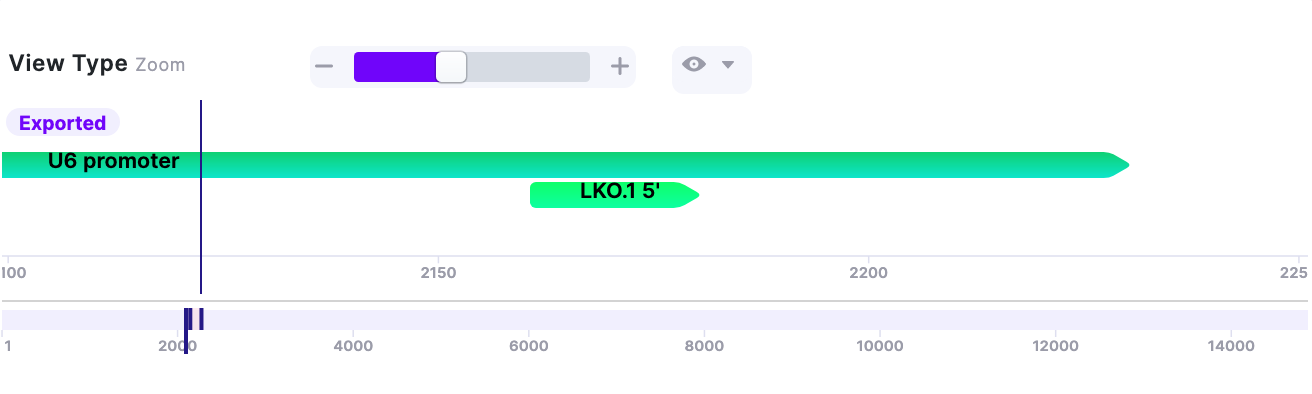 |
2. Expanding the field of view.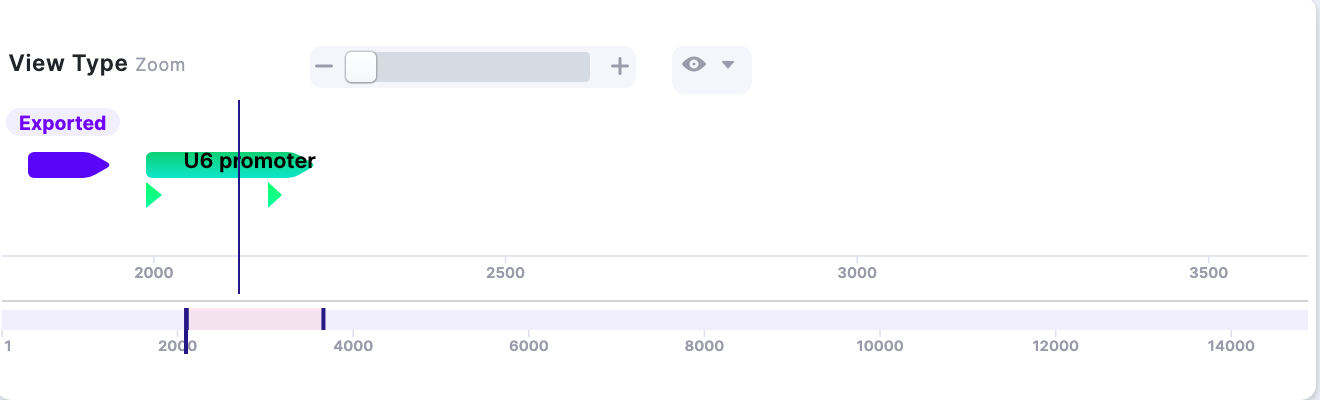 | ||
| Display Filter |
| 1. All Visibility Options OFF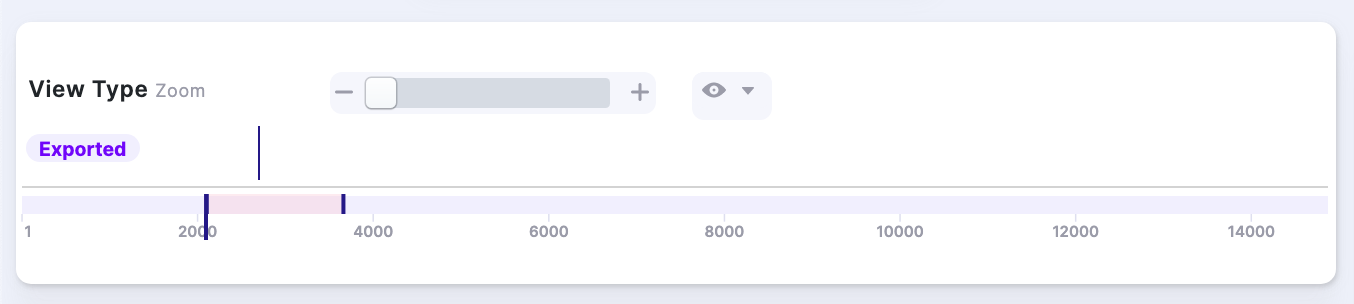 |
2. All Visibility Options ON: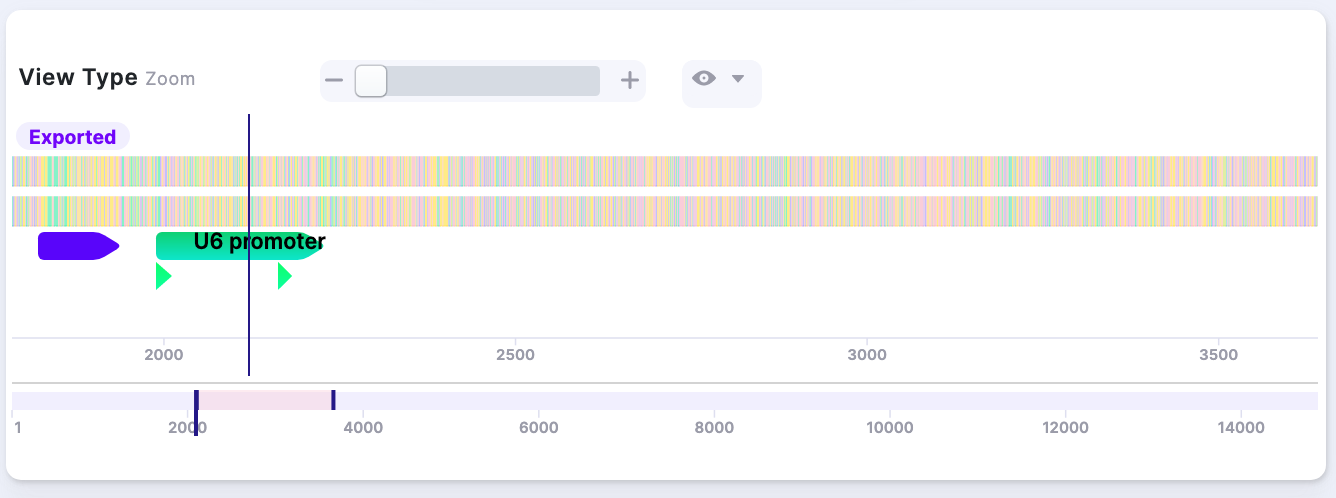 |
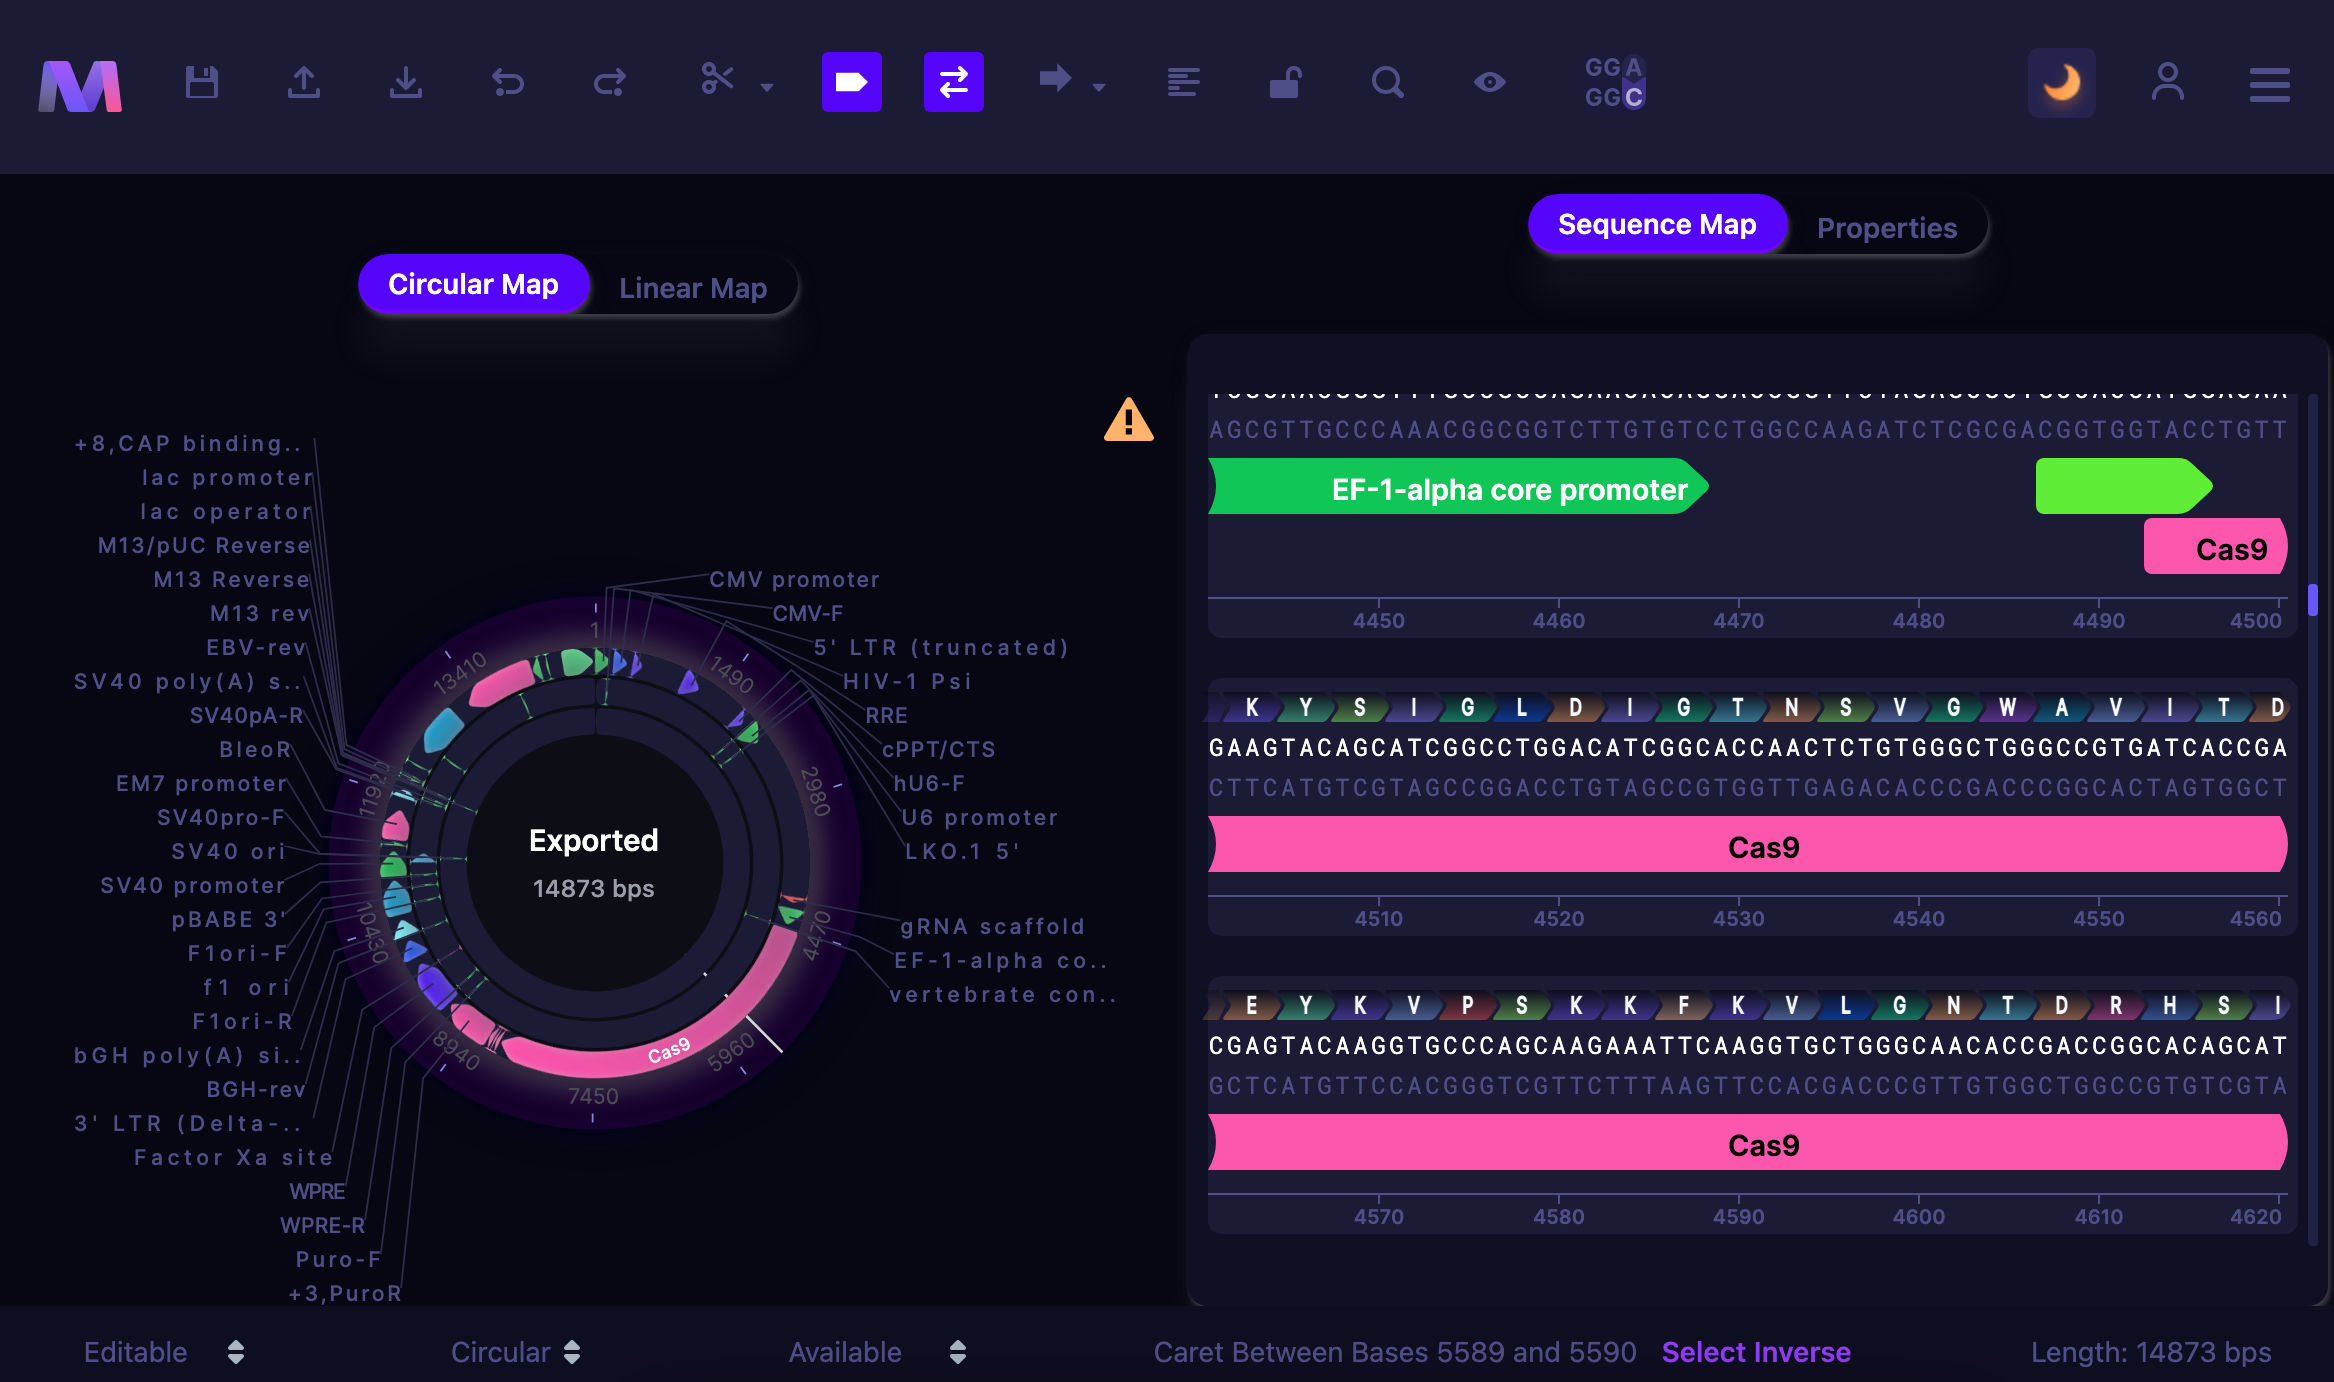
Dark Mode
Mendelgen features a dark mode for low-light settings, helping to reduce the strain on the eyes. To enable a dark mode, click the moon icon on the control panel.
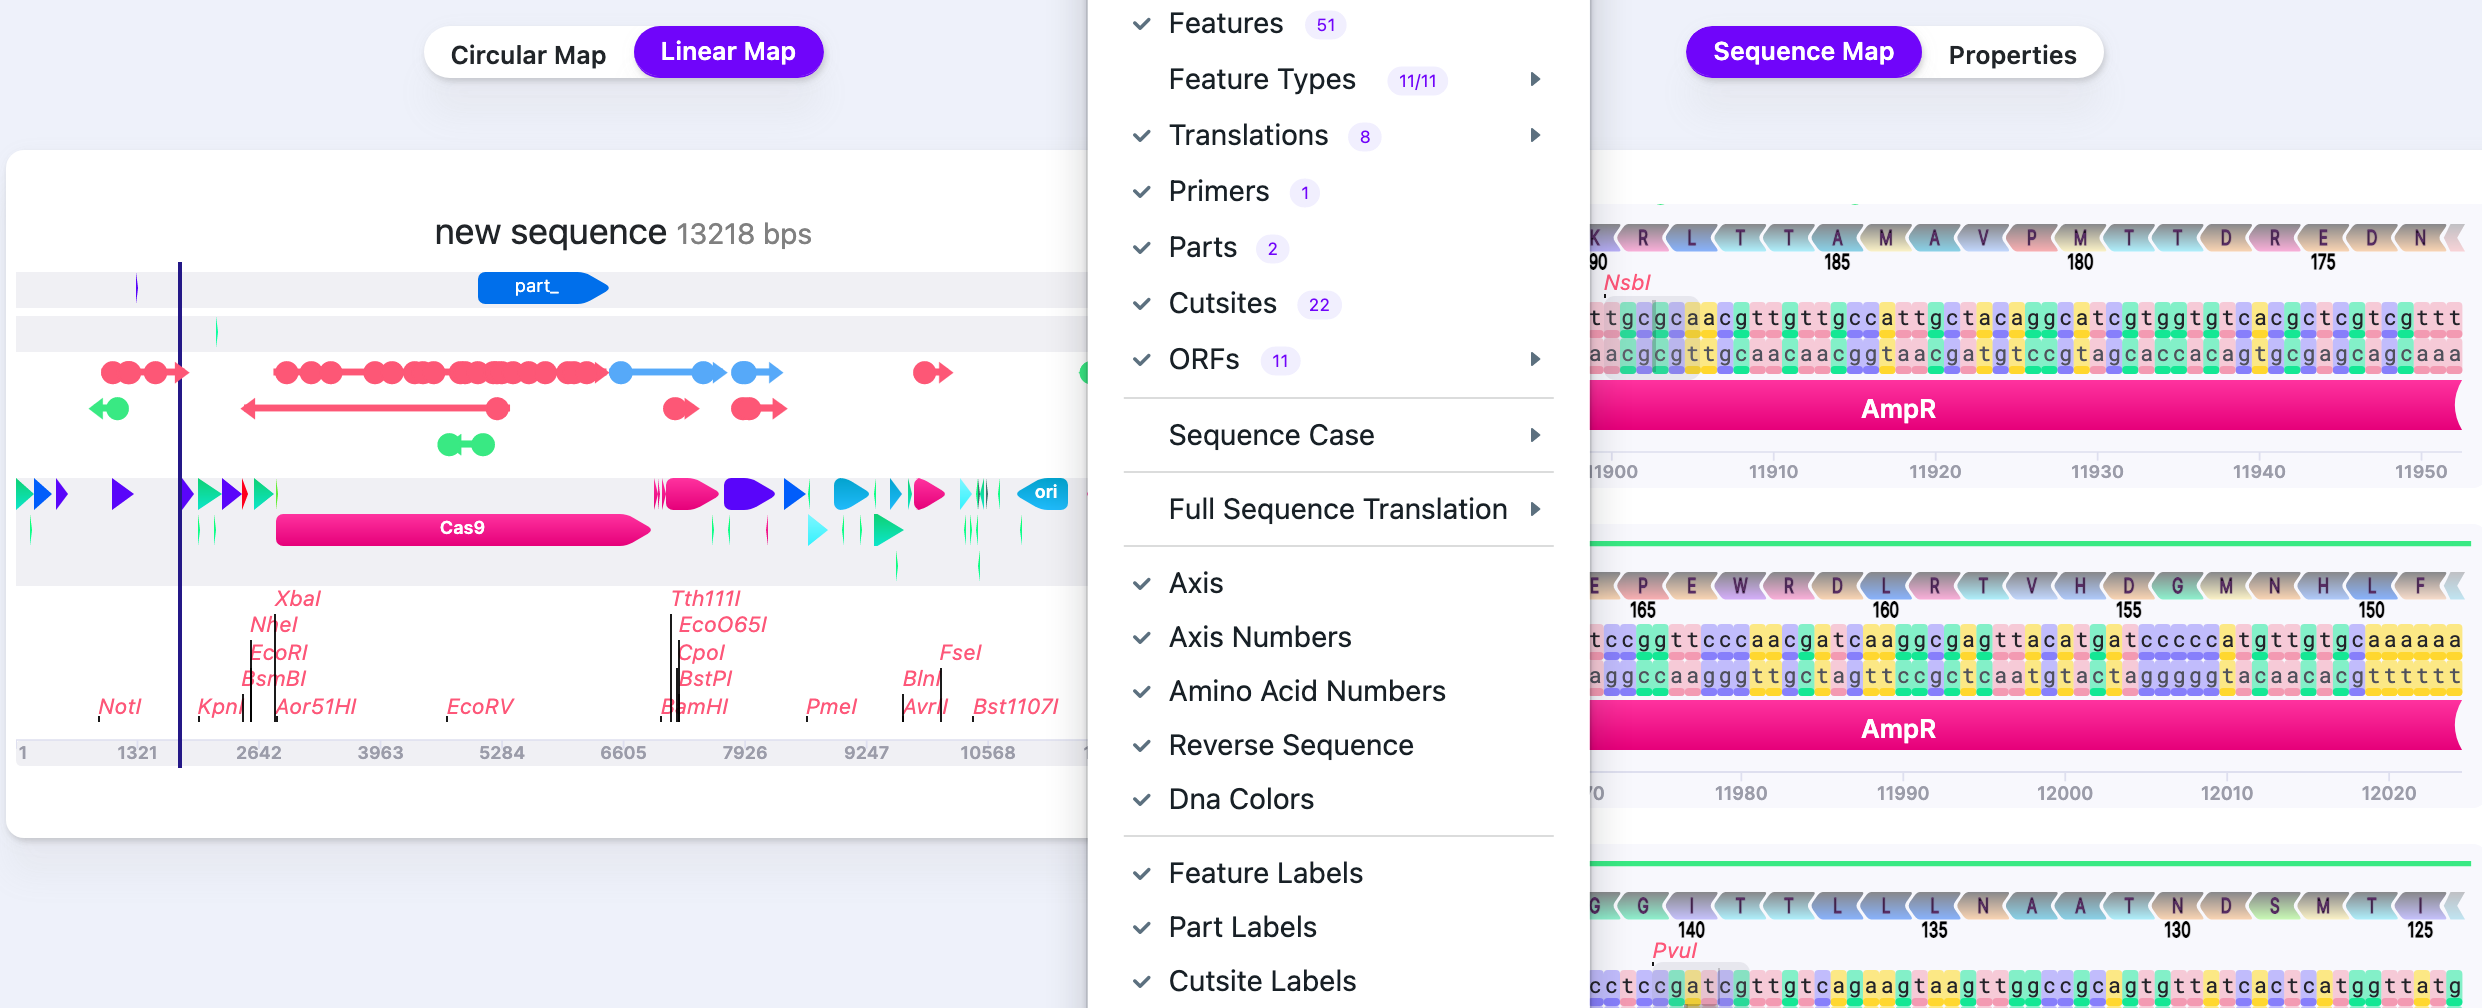
Visibility Options
| Options | Filters | Description | Preview |
|---|---|---|---|
| Show All | Shows all selected features, parts, cut sites. | 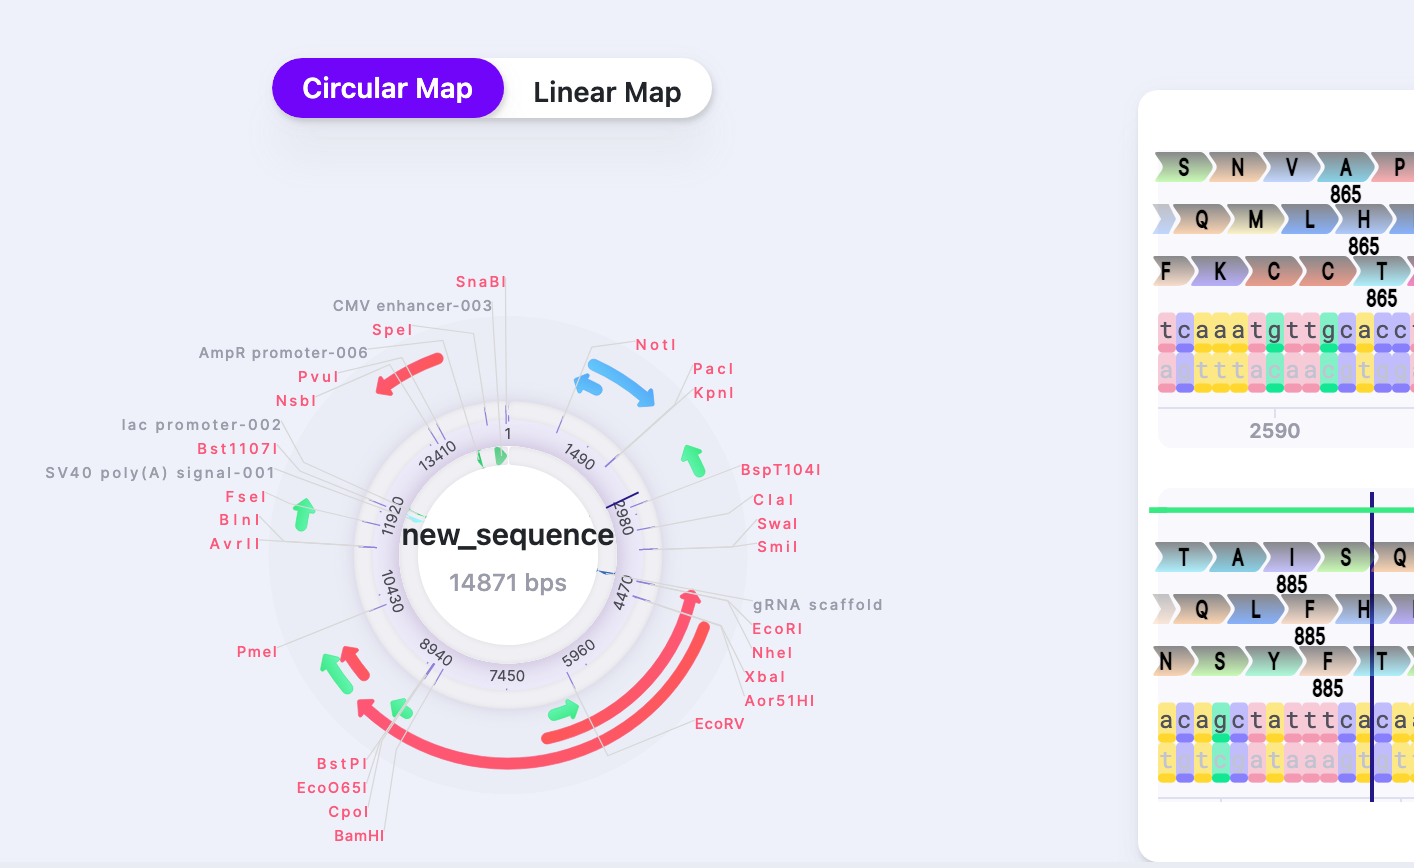 | |
| Hide All | Shows all selected features, parts, cut sites. | 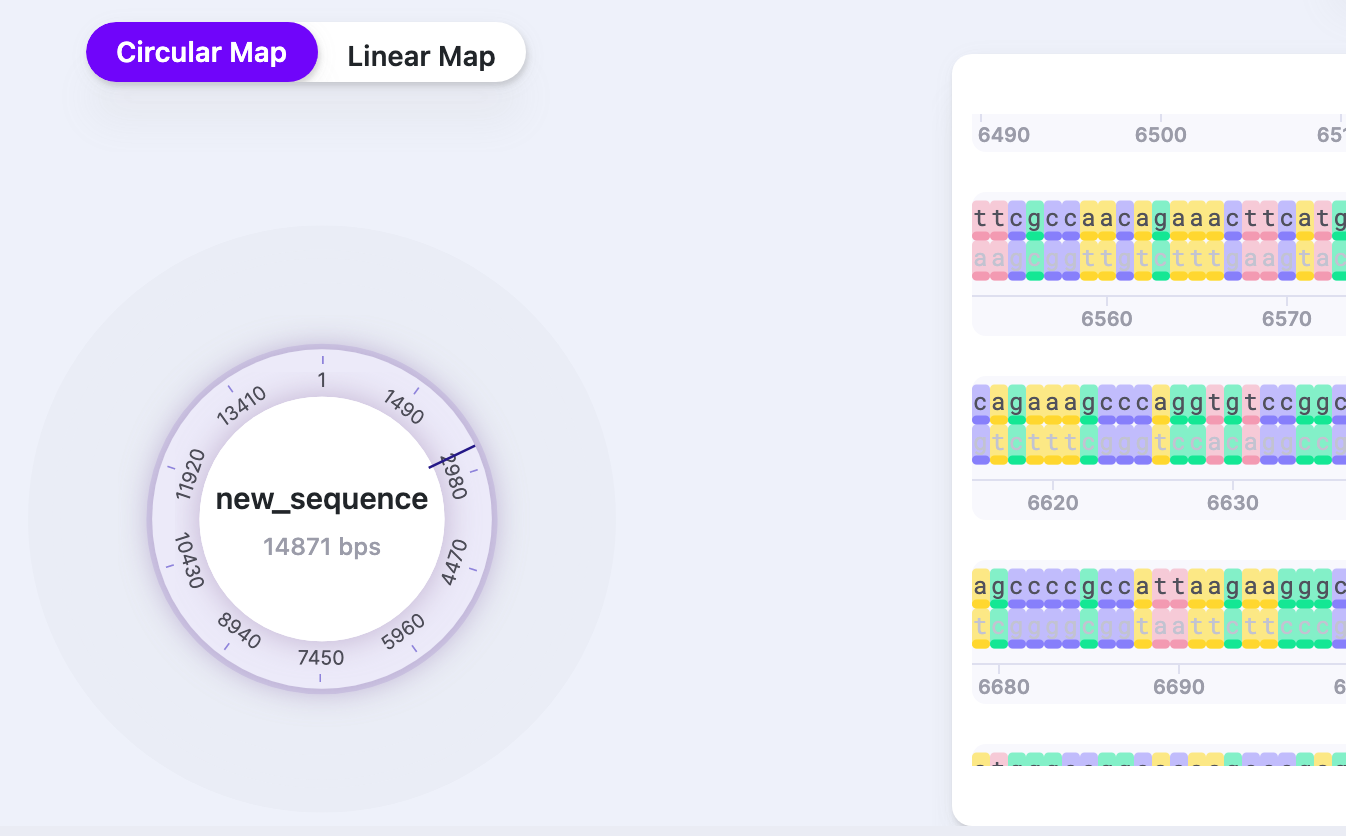 | |
| Features | Show/Hide | Displays/hides features. The number shows the total number of features in the sequence. |  |
| Feature Types |
| Shows groups of features, depending on what is annotated in the plasmid, for example, promoters, enhancers, etc. | 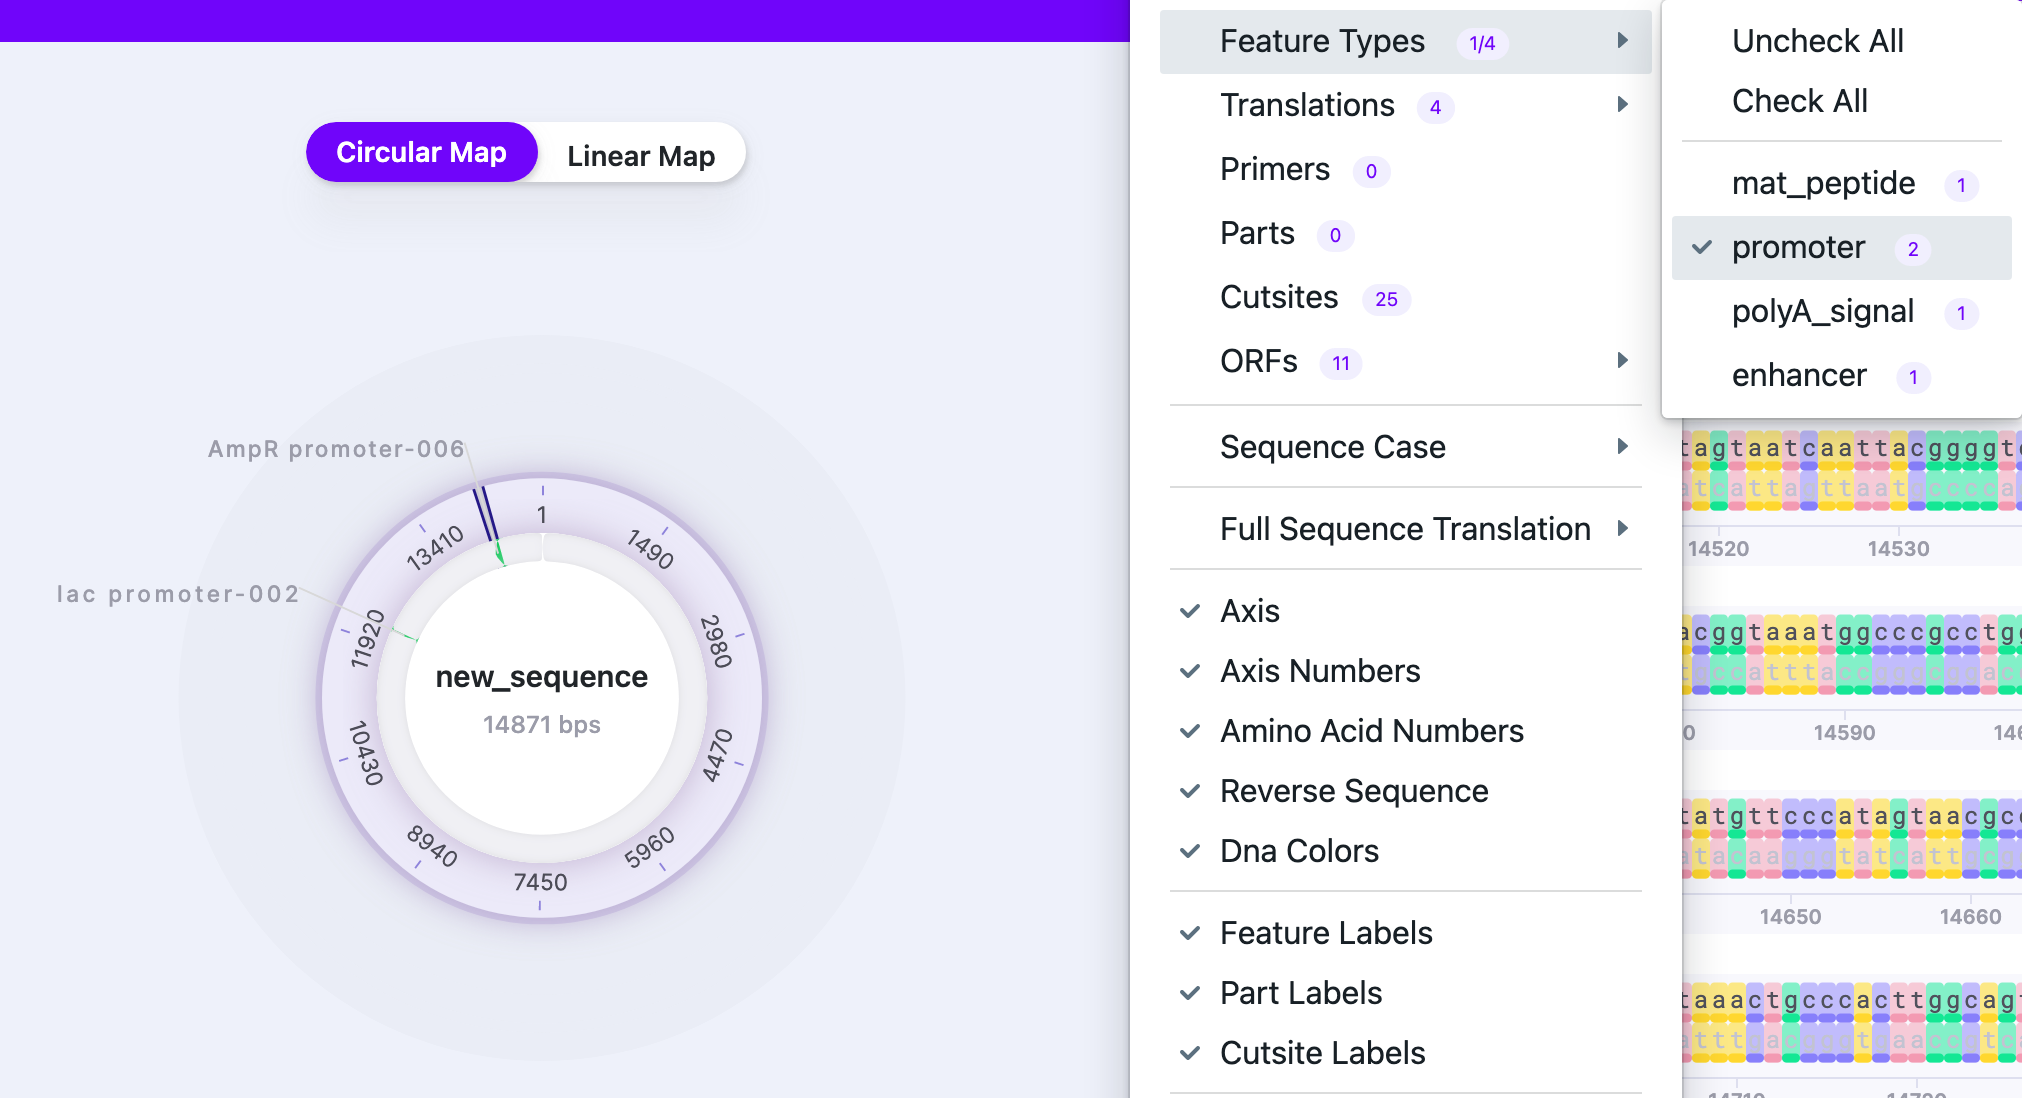 |
| Translations |
| Shows all selected features, parts, cut sites. | |
| Primers | Show/Hide | Displays/hides primers. The number shows the total number of primers in the sequence | 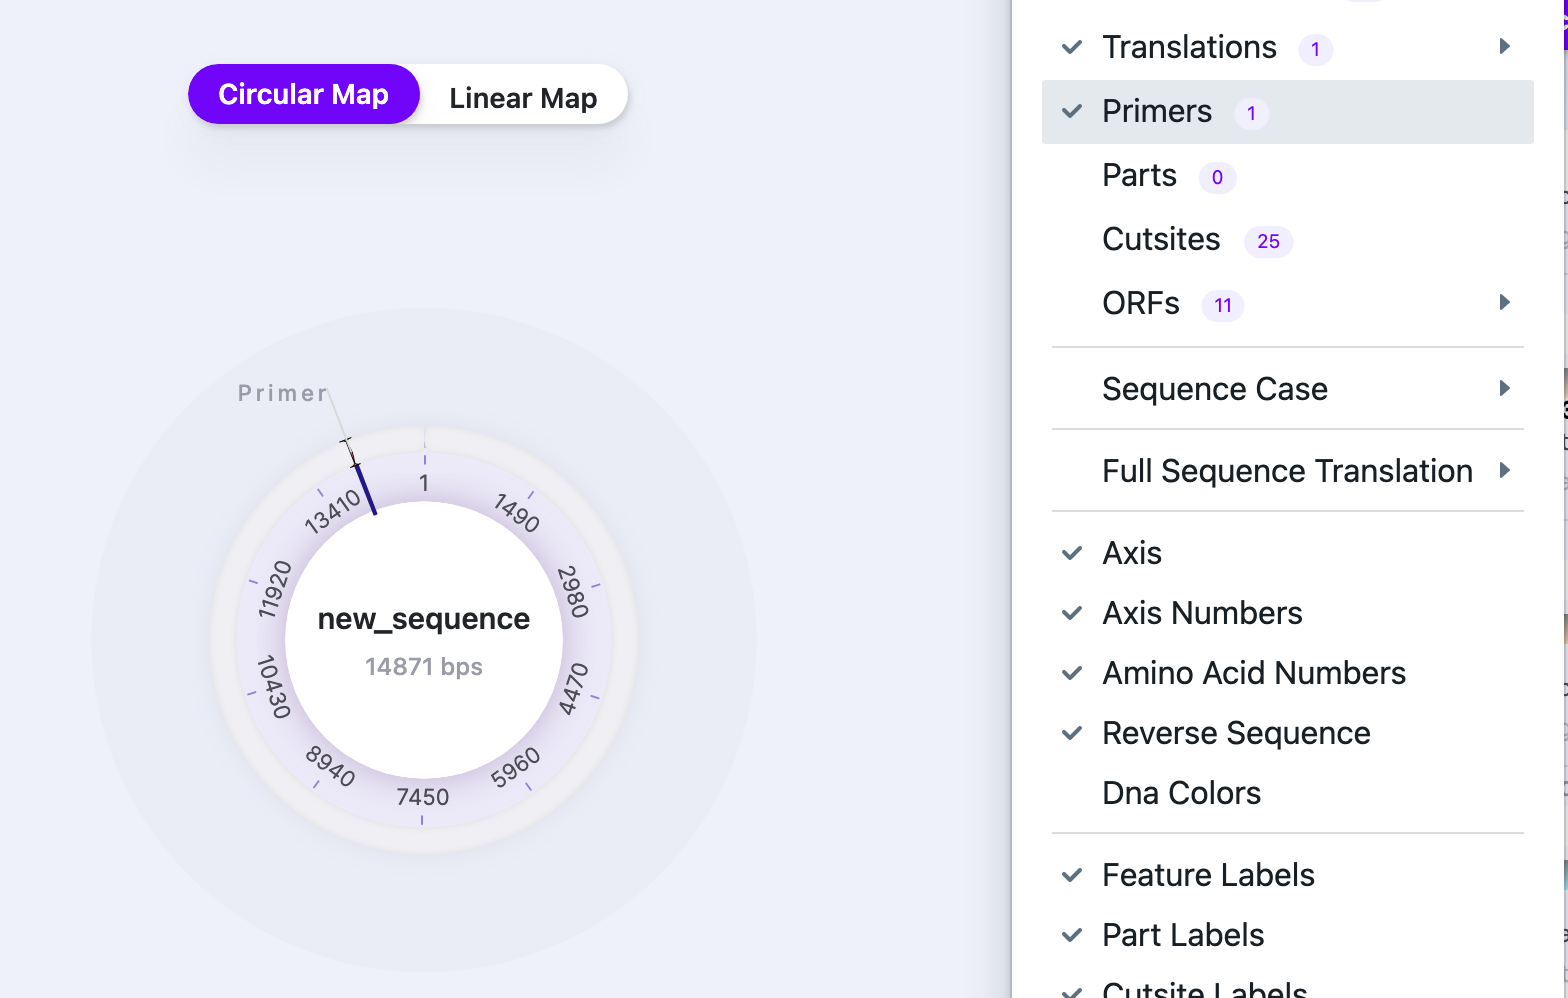 |
| Parts | Show/Hide | Displays/hides parts. The number shows the total number of parts in the sequence | 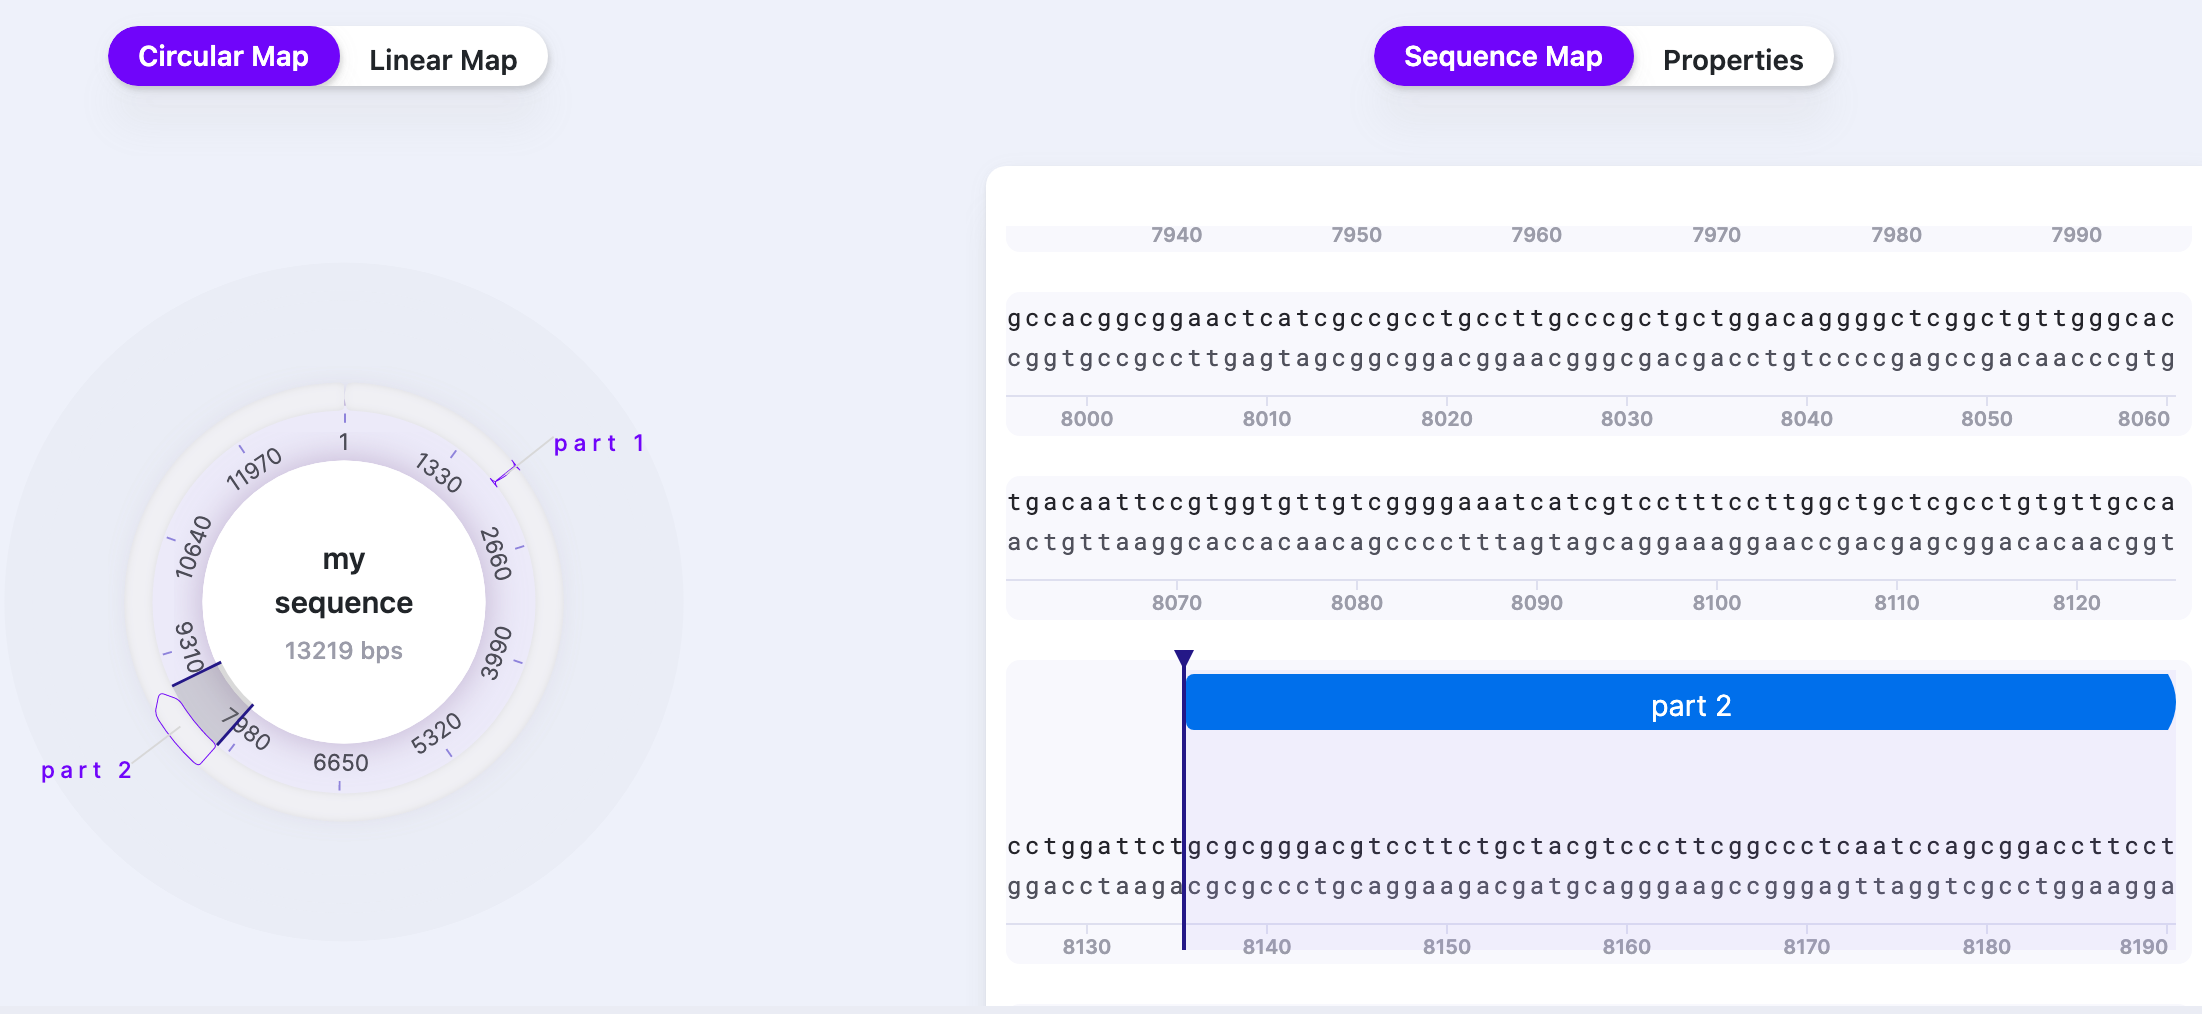 |
| Cut Sites | Show/Hide | Displays/hides cut sites. The number shows the total number of cut sites in the sequence | 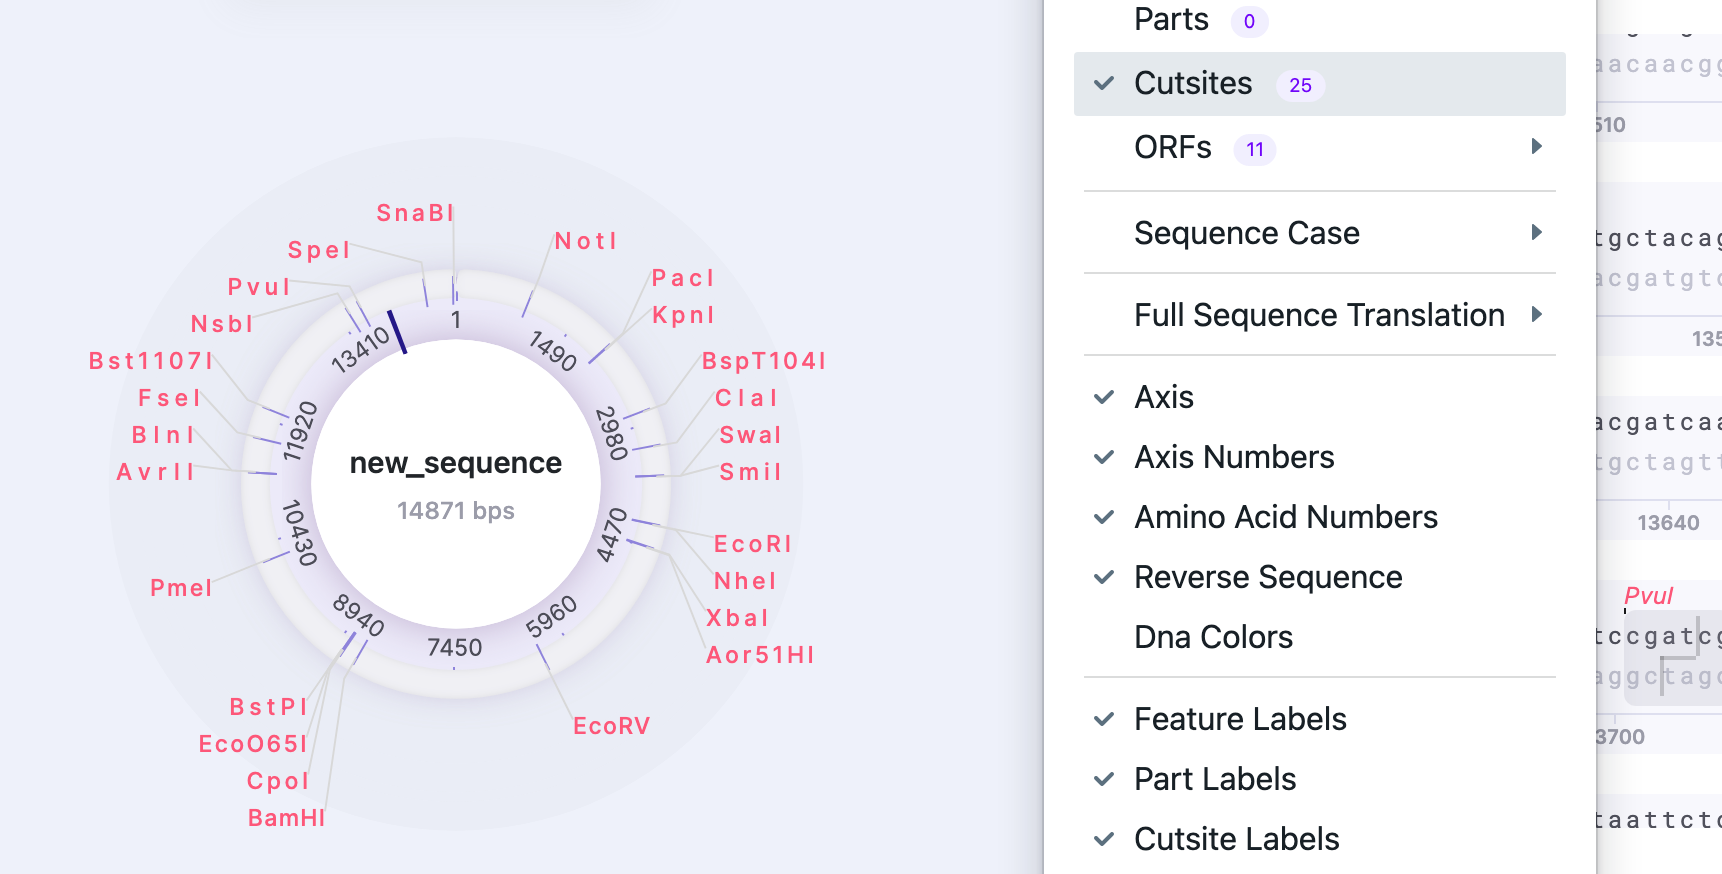 |
| ORFs |
| Displays/hides ORFs. The number shows the total number of ORFs in the sequence | 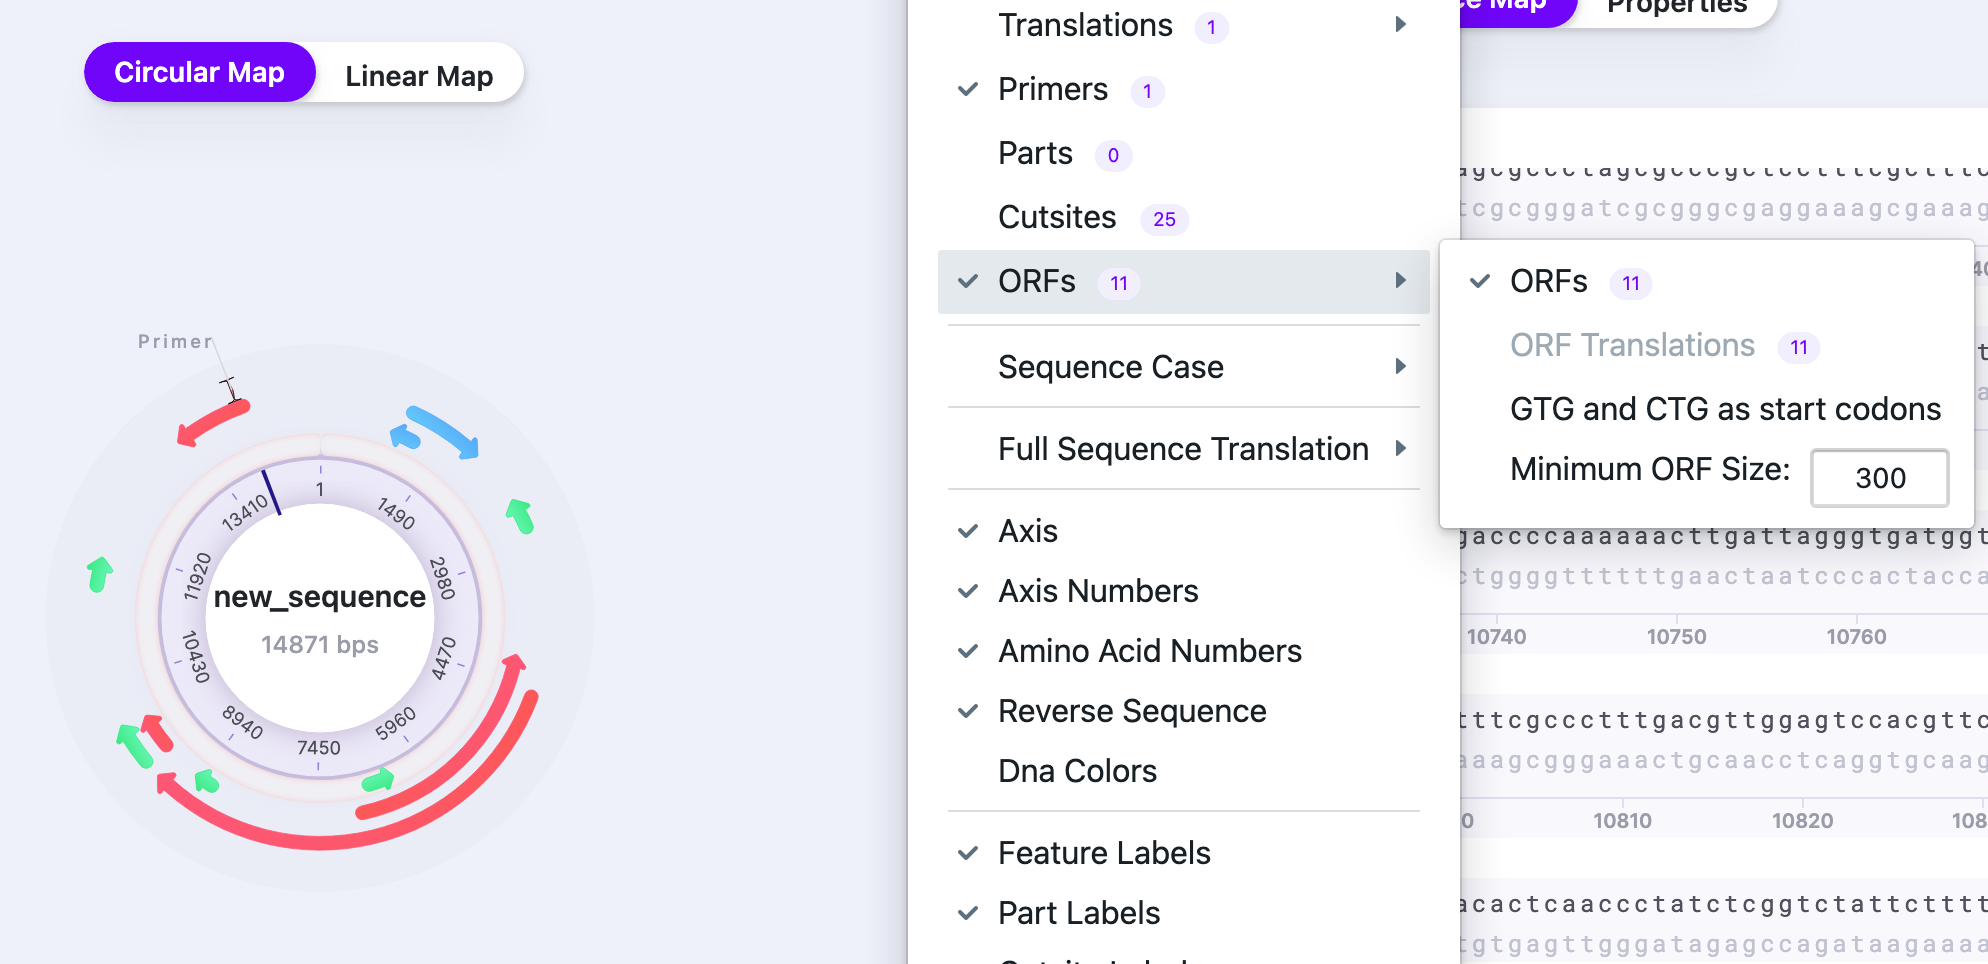 |
| Sequence Case |
| Change nucleotide casing. | 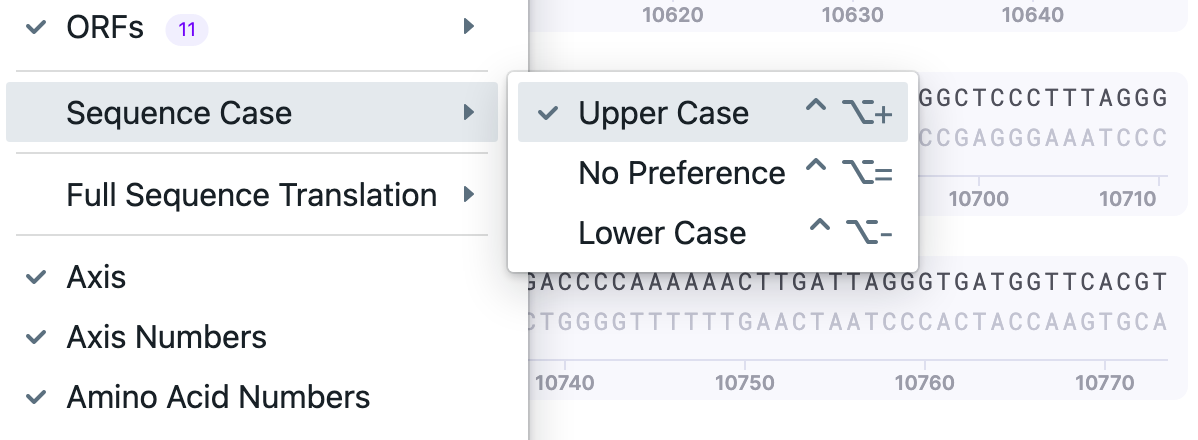 |
| Full Sequence Translation |
| This is the option to translate a full vector sequence. You can select ALL forward/reverse frames or any frame of choice (frame 1, frame 2, frame 3). | |
| Axis / Axis Numbers | Show/Hide | The axis (together with axis numbers) shows the numbering for base pairs positions. | 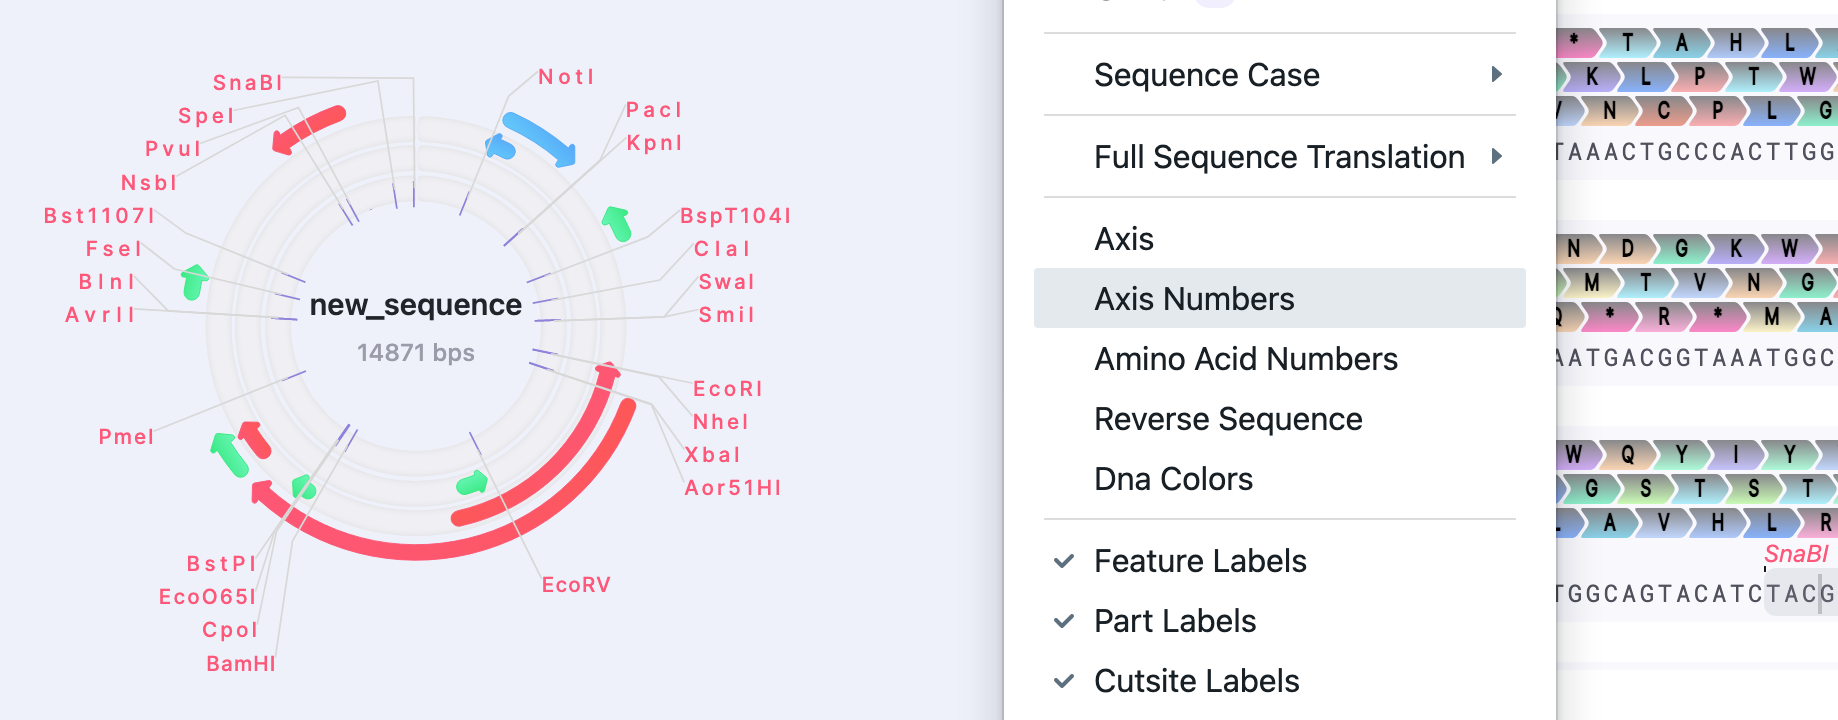 |
| Amino Acid Numbers | Show/Hide | The numbering with a step of 5 (0…5…10…15…) is shown for the position of the amino acids, if the translation was performed. | 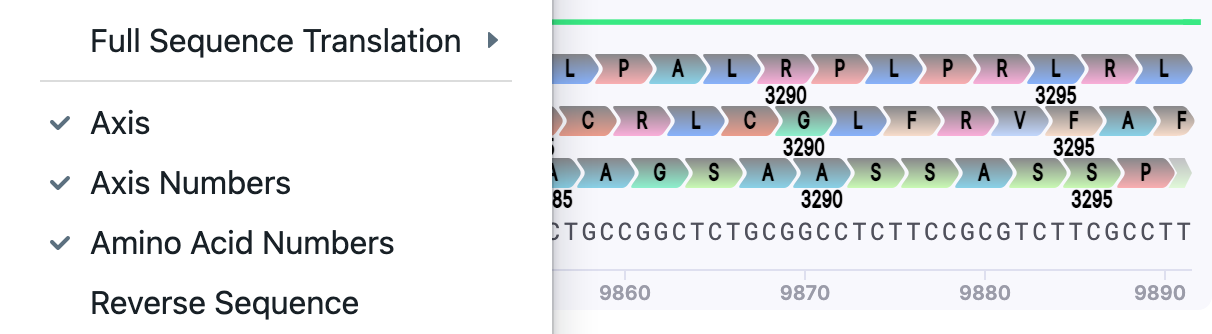 |
| Reverse Sequence | Show/Hide | Reverse sequence displays the 3’–5’ second, complementary DNA strand. | |
| DNA colors | Show/Hide | The bases are colored. | 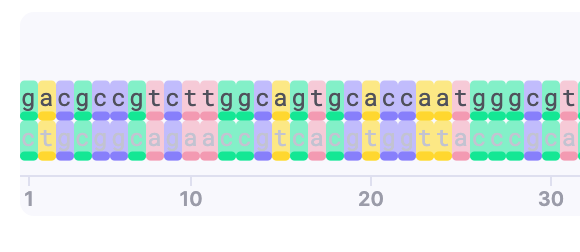 |
| Feature Labels | Show/Hide | Shows/Hides the feature names when “Features” are selected to be displayed. | 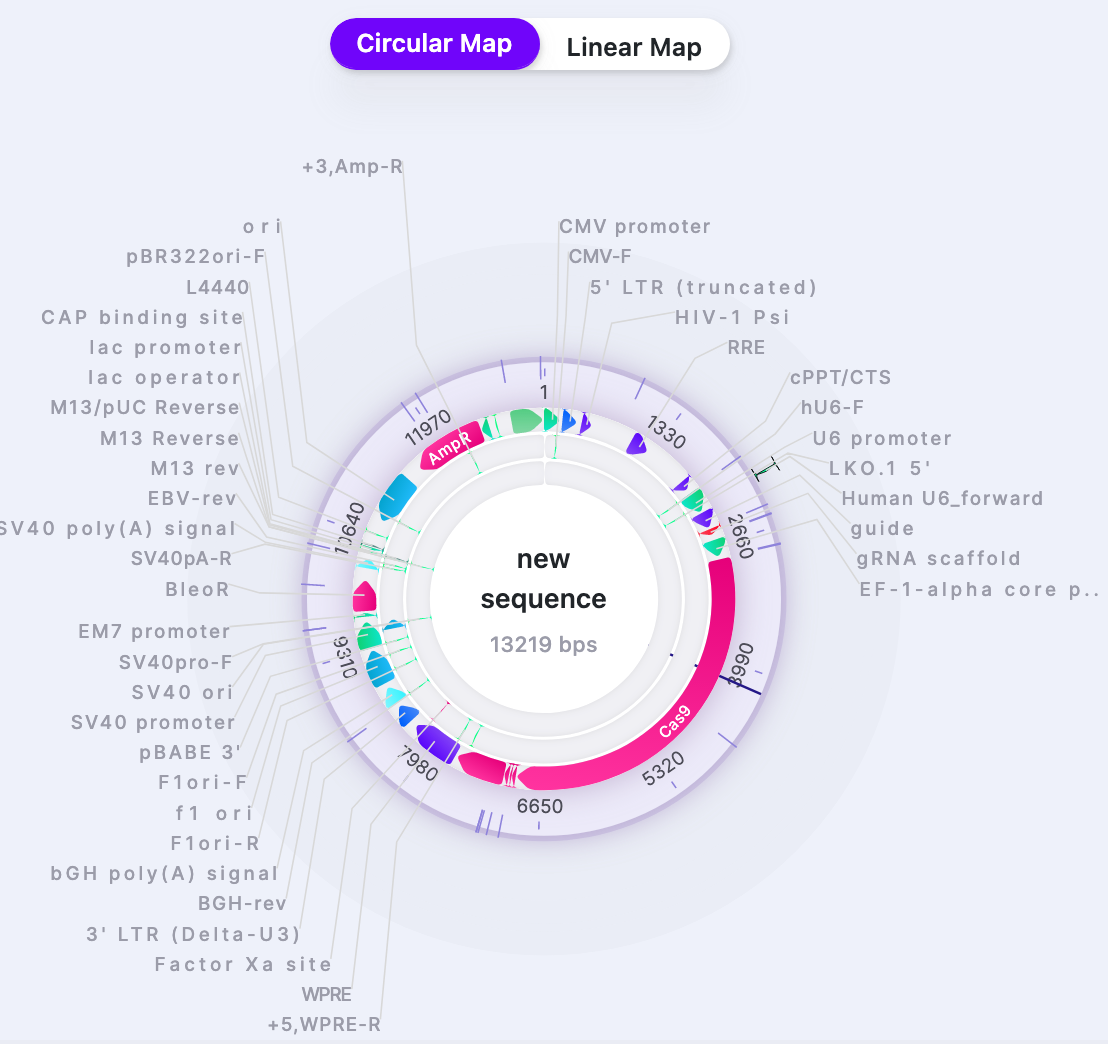 |
| Part Labels | Show/Hide | Shows/Hides the label names when “Labels” are selected to be displayed. | 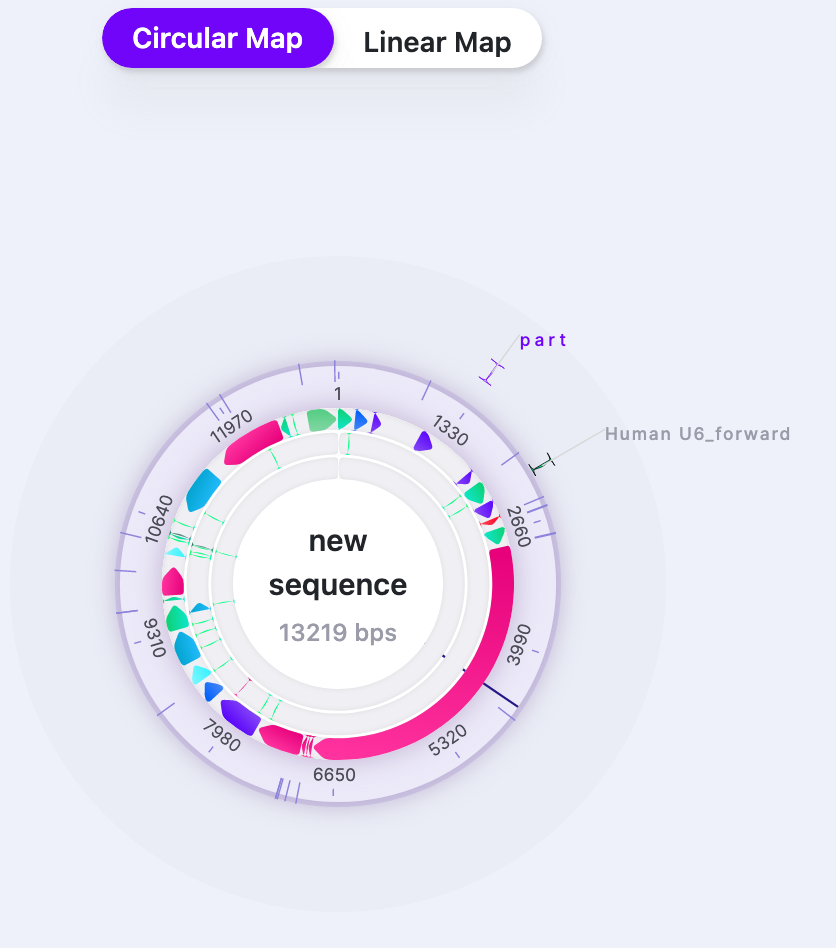 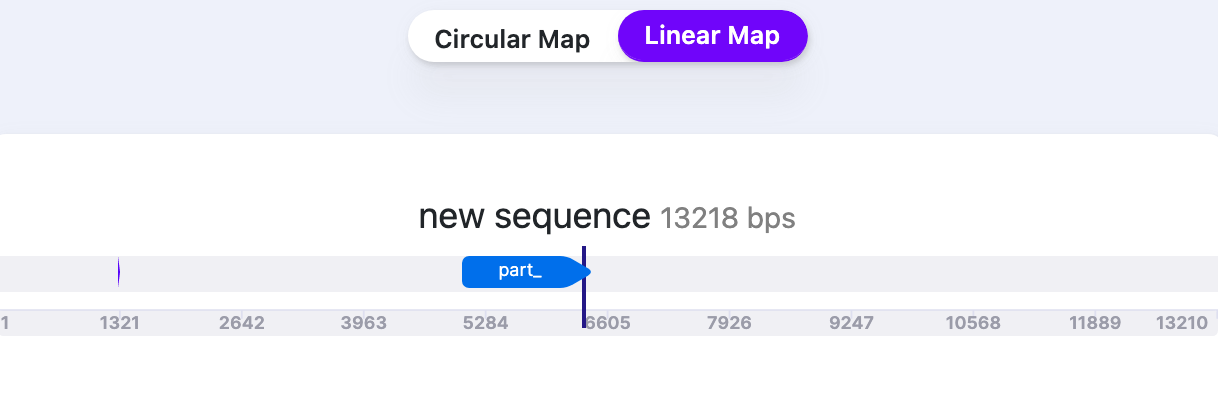 |
| Cut Site Labels | Show/Hide | Shows/Hides the restriction sites names. | 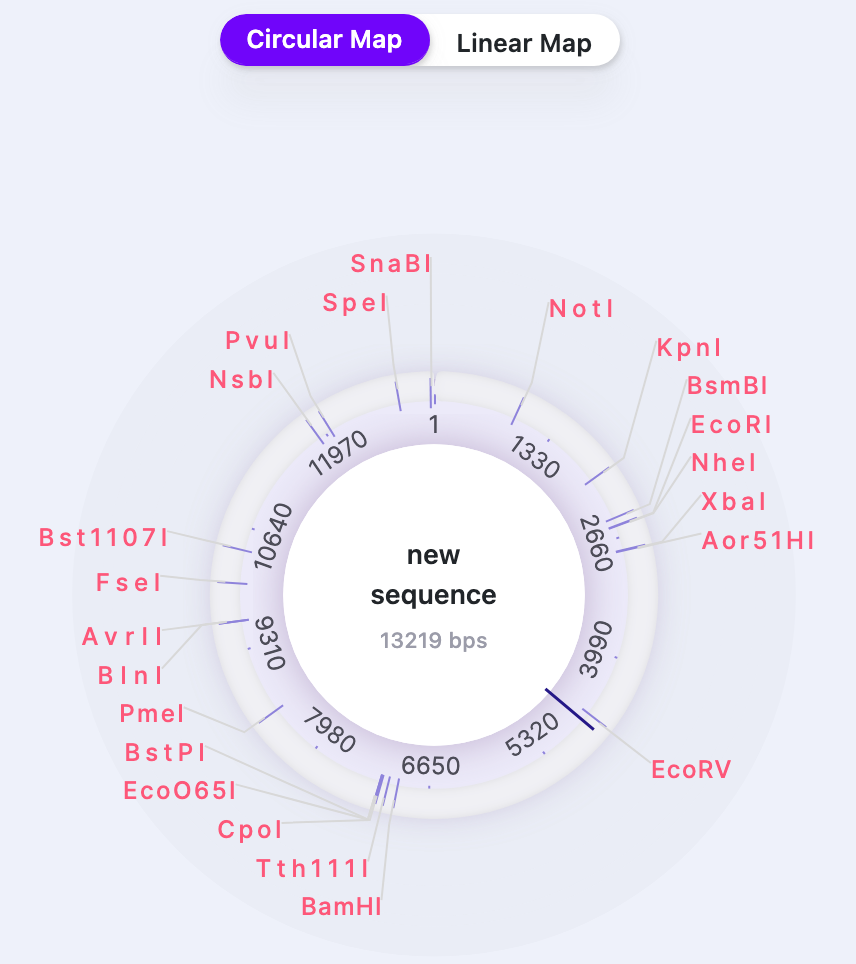 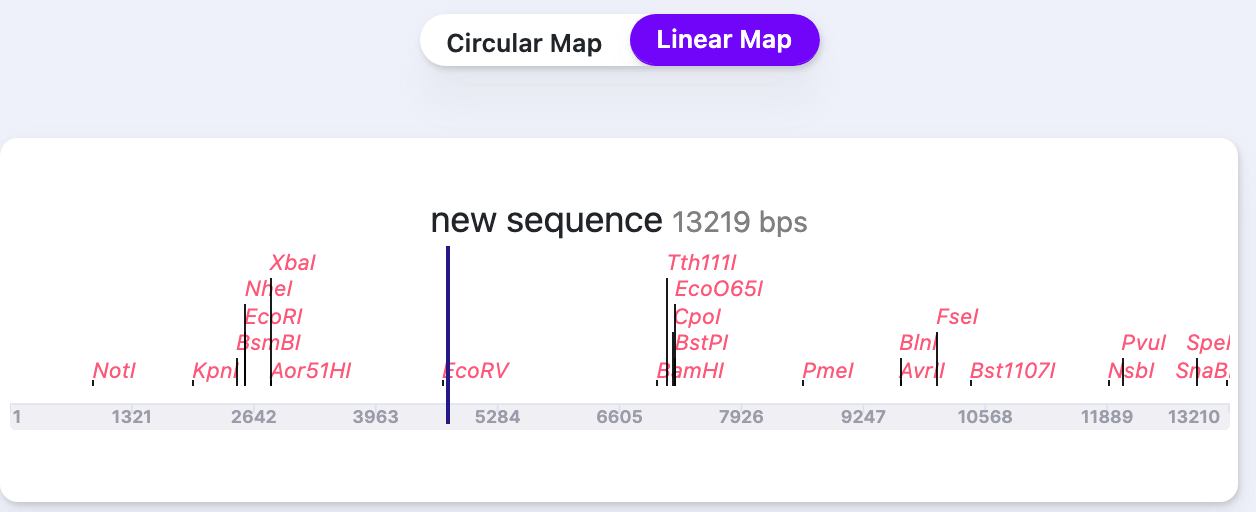 |
| External Labels (Linear Map) | Show/Hide | Shows/Hides the labels of Features/Primers/Parts on Linear map. | 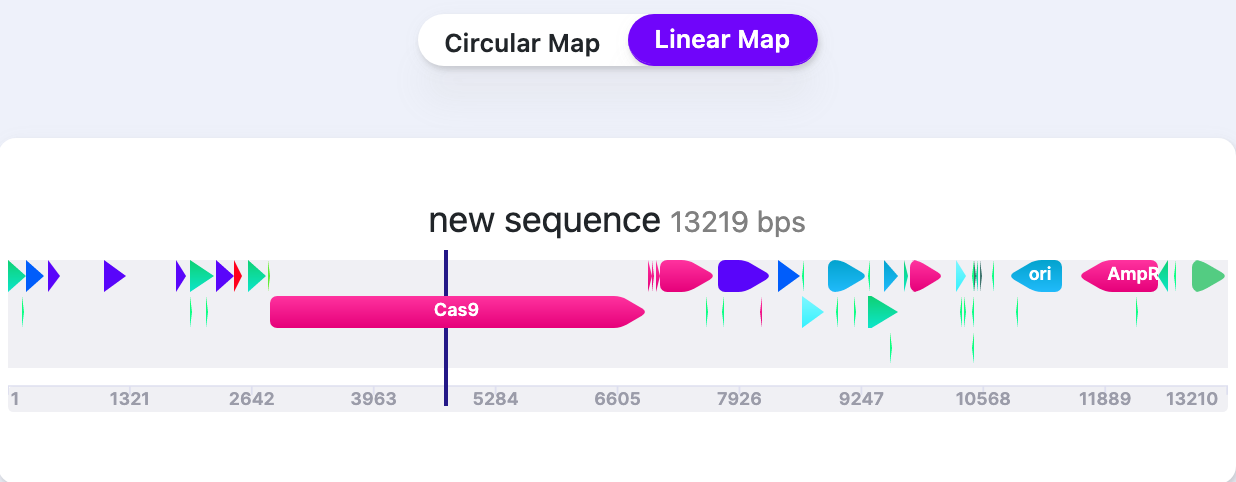 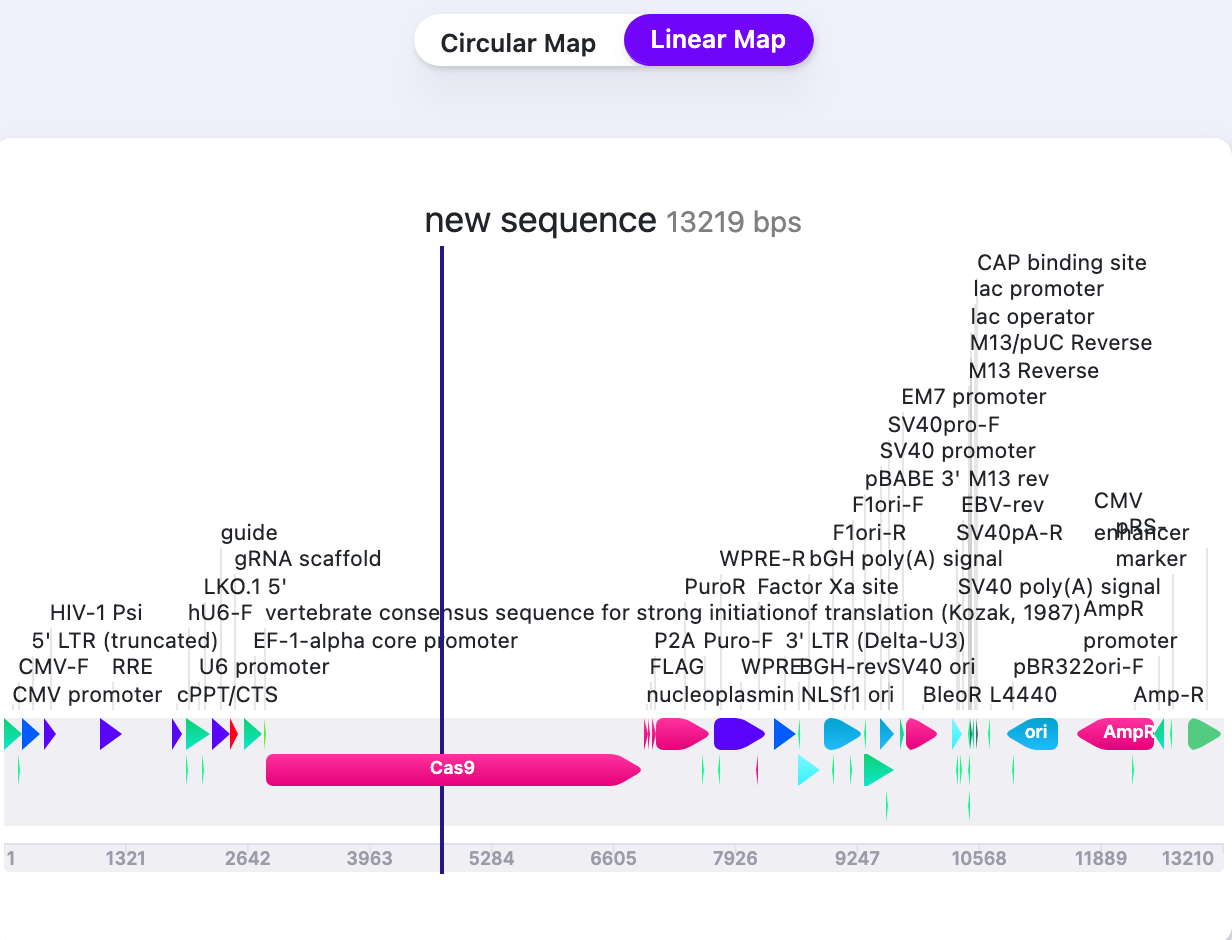 |
| Label Line Intensity (Linear map) | Show/Hide | Changes the thickness of label lines. | 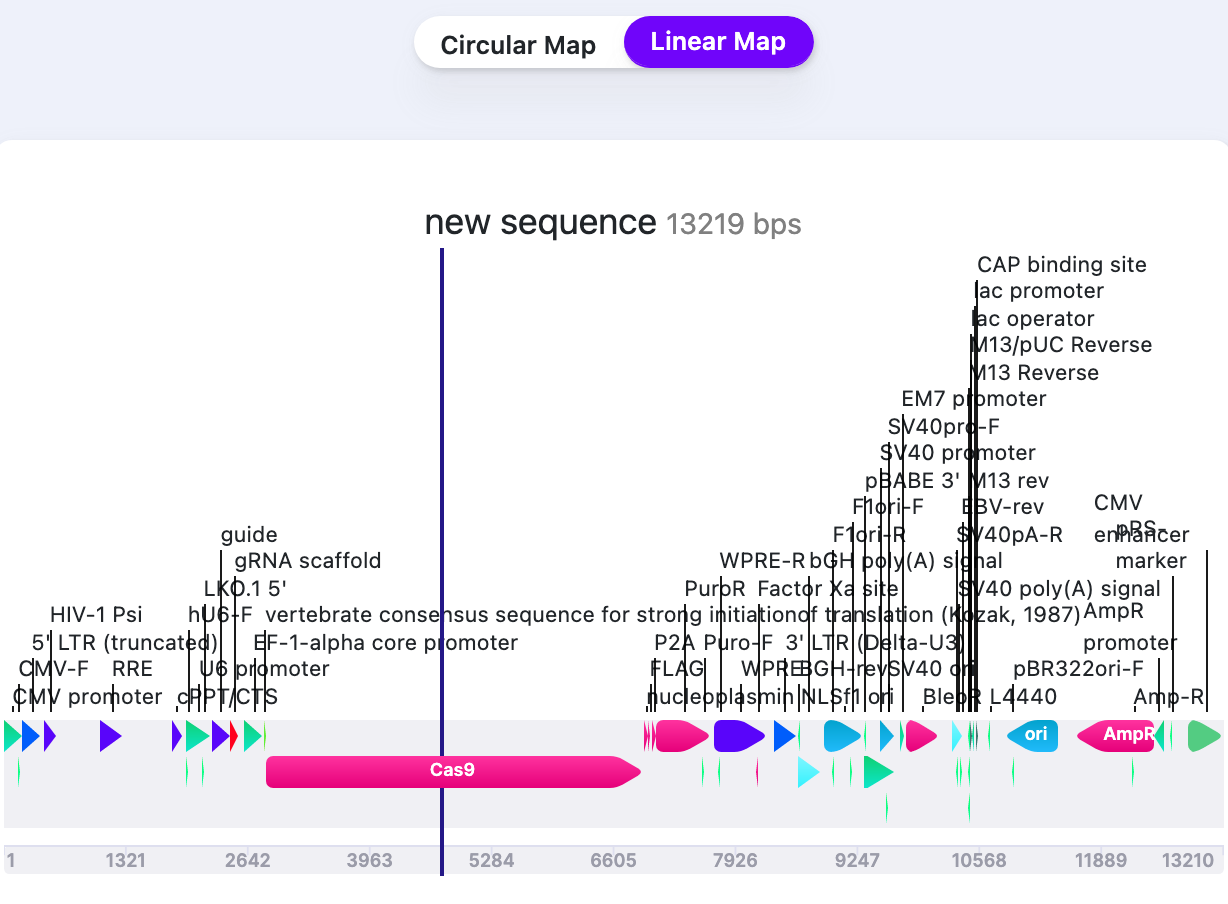 |
All display levels of Circular Map:
All display levels of Linear Map: